


此示例演示如何使用 OpenCV 进行表格数据检测和提取。我们将分析以下代码生成的一些示例输出。此代码的 Colab 链接可在文章末尾找到。
示例输出:
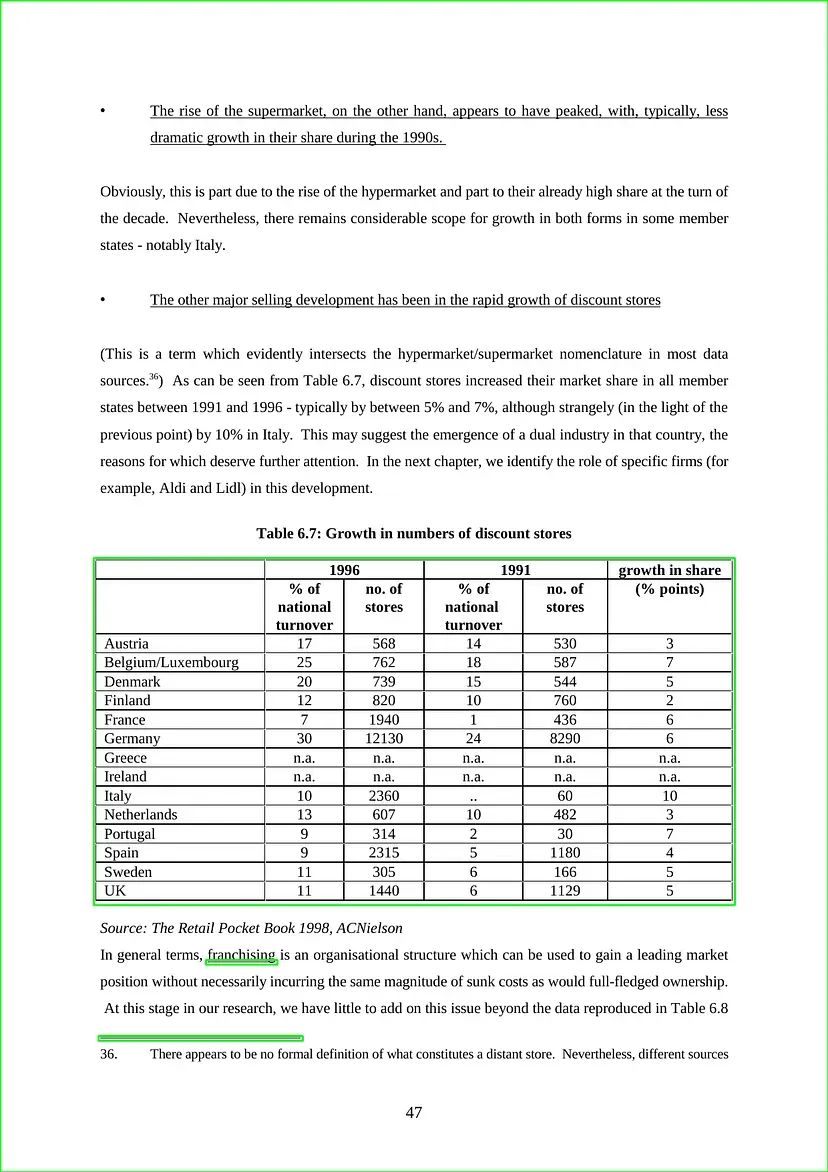
检测到表格的输出
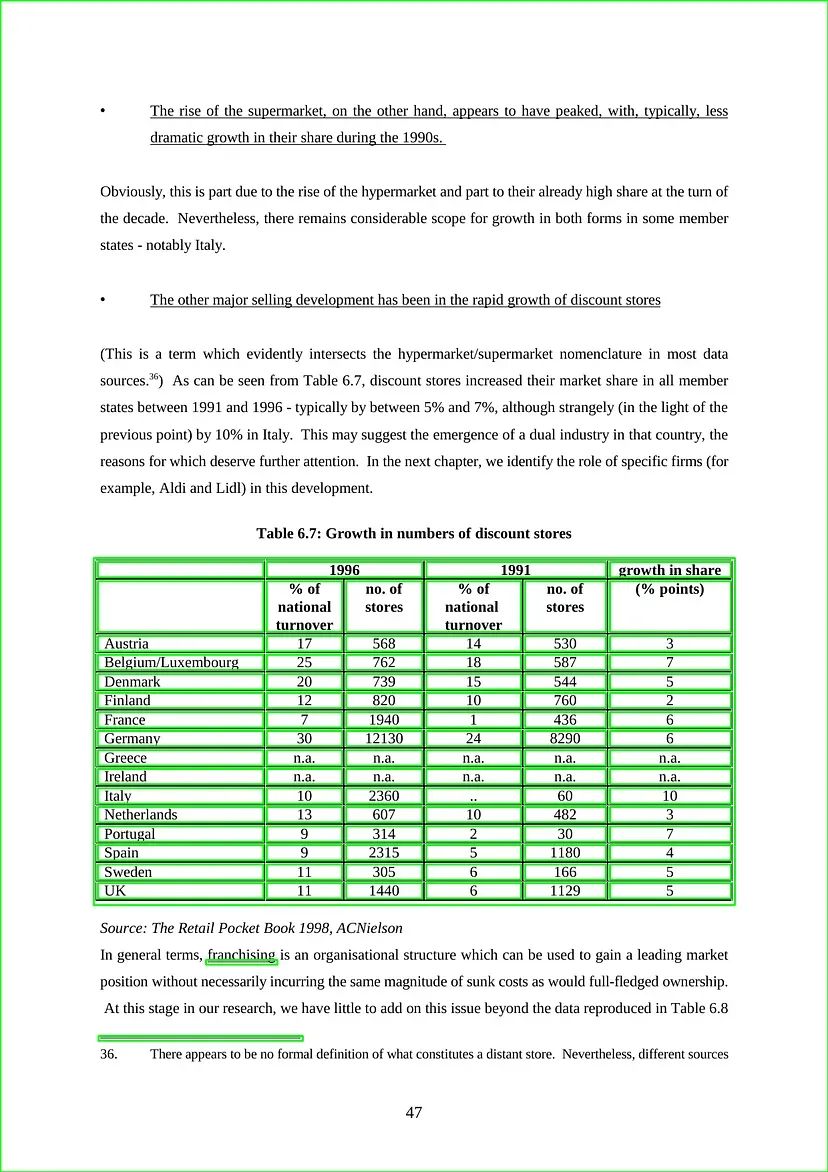
检测到单元格的表格输出


表格单元格的裁剪图像
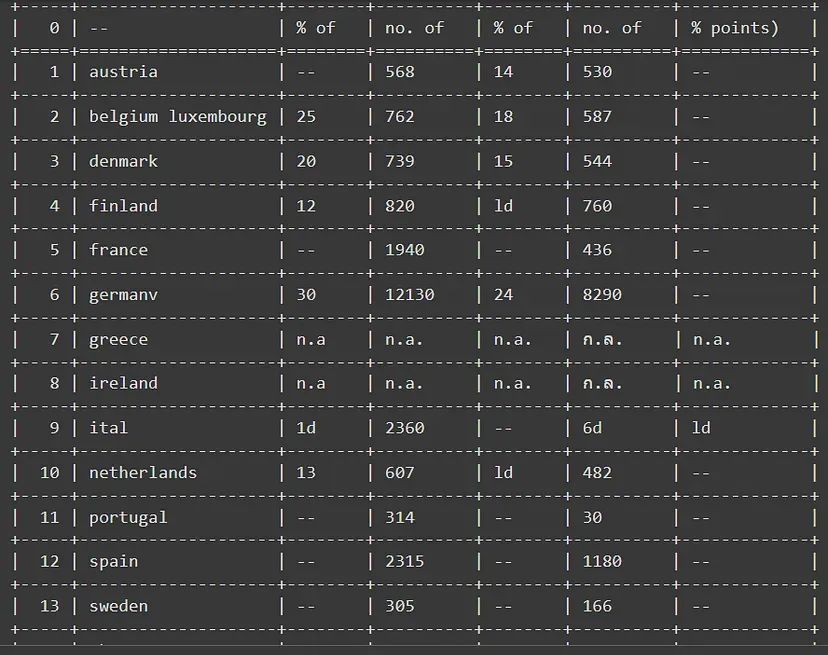
表格提取数据的输出
from google.colab.patches import cv2_imshow
import pandas as pd
import cv2
import numpy as np
import easyocr
reader = easyocr.Reader(['th','en'])def table_detection(img_path):
img = cv2.imread(img_path)
img_gray = cv2.cvtColor(img, cv2.COLOR_BGR2GRAY)
(thresh, img_bin) = cv2.threshold(img_gray, 128, 255, cv2.THRESH_BINARY | cv2.THRESH_OTSU)
img_bin = cv2.bitwise_not(img_bin)
kernel_length_v = (np.array(img_gray).shape[1])//120
vertical_kernel = cv2.getStructuringElement(cv2.MORPH_RECT, (1, kernel_length_v))
im_temp1 = cv2.erode(img_bin, vertical_kernel, iterations=3)
vertical_lines_img = cv2.dilate(im_temp1, vertical_kernel, iterations=3)
kernel_length_h = (np.array(img_gray).shape[1])//40
horizontal_kernel = cv2.getStructuringElement(cv2.MORPH_RECT, (kernel_length_h, 1))
im_temp2 = cv2.erode(img_bin, horizontal_kernel, iterations=3)
horizontal_lines_img = cv2.dilate(im_temp2, horizontal_kernel, iterations=3)
kernel = cv2.getStructuringElement(cv2.MORPH_RECT, (3, 3))
table_segment = cv2.addWeighted(vertical_lines_img, 0.5, horizontal_lines_img, 0.5, 0.0)
table_segment = cv2.erode(cv2.bitwise_not(table_segment), kernel, iterations=2)
thresh, table_segment = cv2.threshold(table_segment, 0, 255, cv2.THRESH_OTSU)
contours, hierarchy = cv2.findContours(table_segment, cv2.RETR_TREE, cv2.CHAIN_APPROX_SIMPLE)
count = 0
full_list=[]
row=[]
data=[]
first_iter=0
firsty=-1
for c in contours:
x, y, w, h = cv2.boundingRect(c)
if h > 9 and h<100:
if first_iter==0:
first_iter=1
firsty=y
if firsty!=y:
row.reverse()
full_list.append(row)
row=[]
data=[]
print(x,y,w,h)
cropped = img[y:y + h, x:x + w]
cv2_imshow(cropped)
bounds = reader.readtext(cropped)
try:
data.append(bounds[0][1])
data.append(w)
row.append(data)
data=[]
except:
data.append("--")
data.append(w)
row.append(data)
data=[]
firsty=y
cv2.rectangle(img,(x, y),(x + w, y + h),(0, 255, 0), 2)
cv2_imshow(img)
full_list.reverse()
print(full_list)
new_data=[]
new_row=[]
for i in full_list:
for j in i:
new_row.append(j[0])
new_data.append(new_row)
new_row=[]
print(new_data)
# Convert list of lists into a DataFrame
df = pd.DataFrame(new_data)
df = df.applymap(lambda x: '' if pd.isna(x) else x)
from tabulate import tabulate
table = tabulate(df, headers='firstrow', tablefmt='grid')
# Print DataFrame
print(table)table_detection("/content/table.png")1. 图像加载与灰度转换:
使用 cv2.cvtColor(image, cv2.COLOR_BGR2GRAY)
2. 阈值和二值化:
(thresh, img_bin) = cv2.threshold(img_gray, 128, 255, cv2.THRESH_BINARY | cv2.THRESH_OTSU):
应用自适应阈值(Otsu 方法)将灰度图像转换为二进制(黑白)。
阈值(thresh)自动确定以将前景(表格线)与背景分开。
3. 垂直和水平线检测:
1. 内核创建:
kernel_length_v = (np.array(img_gray).shape[1]) // 120 (vertical) 和 kernel_length_h = (np.array(img_gray).shape[0]) /// 40 (horizontal):
根据图像宽度和高度计算核长度,以确保合适的线检测尺寸。
vertical_kernel 和 Horizontal_kernel:为形态学操作创建结构元素(核)。这些本质上是用于腐蚀和膨胀的小矩形。
2.腐蚀和膨胀:
im_temp1 (vertical) 和 im_temp2 (horizontal) :对细线应用腐蚀并消除噪音。
vertical_lines_img (vertical) 和 horizontal_lines_img (horizontal):应用膨胀来加粗检测到的线条。
3. 结合垂直线和水平线:
kernel = cv2.getStructuringElement(cv2.MORPH_RECT, (3, 3)): 创建一个方形内核以便进一步处理。
table_segment = cv2.addWeighted(vertical_lines_img, 0.5, horizontal_lines_img, 0.5, 0.0): 使用加权平均值组合检测到的垂直线和水平线。
4. 额外的腐蚀和阈值处理:
table_segment = cv2.erode(cv2.bitwise_not(table_segment), kernel, iterations=2): 进一步腐蚀组合图像以消除噪音并隔离表格区域。
thresh, table_segment = cv2.threshold(table_segment, 0, 255, cv2.THRESH_OTSU): 再次应用阈值(自适应 Otsu)来细化表格段图像。
5. 细胞检测与提取:
contours, hierarchy = cv2.findContours(table_segment, cv2.RETR_TREE, cv2.CHAIN_APPROX_SIMPLE):查找表段图像中潜在单元的轮廓(边界)。
此示例演示了文本识别。你可以使用任何你熟悉的 OCR 库,例如 EasyOCR。
点击此处在 Colob 中打开代码:
https://colab.research.google.com/drive/1Ml6IDGavNUPZzLV-4ec3Elx__rbF0fHY?usp=sharing
☆ END ☆
如果看到这里,说明你喜欢这篇文章,请转发、点赞。微信搜索「uncle_pn」,欢迎添加小编微信「 woshicver」,每日朋友圈更新一篇高质量博文。
↓扫描二维码添加小编↓


 4万+
4万+

 被折叠的 条评论
为什么被折叠?
被折叠的 条评论
为什么被折叠?
 到【灌水乐园】发言


