import numpy as np
import matplotlib.pyplot as plt
import cartopy.crs as ccrs
import cartopy.feature as cfeature
from cartopy.mpl.gridliner import LONGITUDE_FORMATTER, LATITUDE_FORMATTER
with open(r'D:\GMT\data\china-geospatial-data-GB2312\CN-border-La.gmt') as src:
context = src.read()
blocks = [cnt for cnt in context.split('>') if len(cnt) > 0]
borders = [np.fromstring(block, dtype=float, sep=' ') for block in blocks]
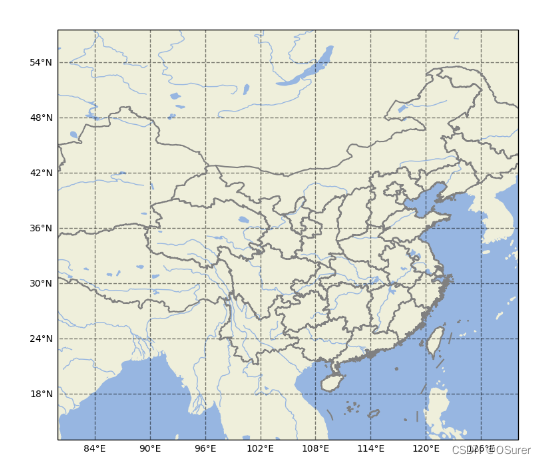
fig = plt.figure(figsize=[12, 8])
ax = plt.axes(projection=ccrs.PlateCarree())
ax.add_feature(cfeature.OCEAN.with_scale('50m'))
ax.add_feature(cfeature.LAND.with_scale('50m'))
ax.add_feature(cfeature.RIVERS.with_scale('50m'))
ax.add_feature(cfeature.LAKES.with_scale('50m'))
for line in borders:
ax.plot(line[0::2], line[1::2], '-', color='gray',transform=ccrs.Geodetic())
gl = ax.gridlines(draw_labels=True, linewidth=1, color='k', alpha=0.5, linestyle='--')
gl.xlabels_top = False
gl.ylabels_right = False
gl.xformatter = LONGITUDE_FORMATTER
gl.yformatter = LATITUDE_FORMATTER
ax.set_extent([80, 130, 13, 55])
plt.show()


 6414
6414

 被折叠的 条评论
为什么被折叠?
被折叠的 条评论
为什么被折叠?
 到【灌水乐园】发言


