由于是帮朋友做的, 他直接把模型给了我, 建模本人也不太了解, 下面就直接放一下模型.
min
f
(
x
,
y
,
z
)
=
∑
i
=
1
T
{
c
1
i
∣
x
i
−
p
i
∣
+
c
2
i
(
y
i
+
b
i
−
d
i
)
+
}
s
.
t
.
{
x
i
+
l
i
≤
L
,
i
=
1
,
2
,
⋯
,
L
x
i
+
l
i
≤
x
j
+
M
(
1
−
Z
i
j
x
)
,
i
=
1
,
⋯
,
l
;
j
=
1
,
⋯
,
l
;
i
≠
j
y
i
+
b
i
≤
y
j
+
M
(
1
−
Z
i
j
y
)
,
i
=
1
,
⋯
,
l
;
j
=
1
,
⋯
,
l
;
i
≠
j
Z
i
j
x
+
Z
i
j
y
+
Z
j
i
x
+
Z
j
i
y
≥
1
,
i
=
1
,
⋯
,
l
;
j
=
1
,
⋯
,
l
;
i
<
j
y
i
≥
a
i
,
i
=
1
,
⋯
,
l
x
i
≥
0
,
i
=
1
,
⋯
,
l
Z
i
j
x
,
Z
i
j
y
=
0
,
1
,
i
=
1
,
⋯
,
l
;
j
=
1
,
⋯
,
l
;
i
≠
j
\min f(x, y, z)=\sum_{i=1}^{T}\left\{c_{1 i}\left|x_{i}-p_{i}\right|+c_{2 i}\left(y_{i}+b_{i}-d_{i}\right)^{+}\right\} \\ s.t. \left\{ \begin{array}{l} x_{i}+l_{i} \leq L, i=1,2, \cdots, L \\ x_{i}+l_{i} \leq x_{j}+M\left(1-Z_{i j}^{x}\right), i=1, \cdots, l ; j=1, \cdots, l ; i \neq j \\ y_{i}+b_{i} \leq y_{j}+M\left(1-Z_{i j}^{y}\right), i=1, \cdots, l ; j=1, \cdots, l ; i \neq j \\ Z_{i j}^{x}+Z_{i j}^{y}+Z_{j i}^{x}+Z_{j i}^{y} \geq 1, i=1, \cdots, l ; j=1, \cdots, l ; i<j \\ y_{i} \geq a_{i}, i=1, \cdots, l \\ x_{i} \geq 0, i=1, \cdots, l \\ Z_{i j}^{x}, Z_{i j}^{y}=0,1, i=1, \cdots, l ; j=1, \cdots, l ; i \neq j \\ \end{array} \right.
minf(x,y,z)=i=1∑T{c1i∣xi−pi∣+c2i(yi+bi−di)+}s.t.⎩⎨⎧xi+li≤L,i=1,2,⋯,Lxi+li≤xj+M(1−Zijx),i=1,⋯,l;j=1,⋯,l;i=jyi+bi≤yj+M(1−Zijy),i=1,⋯,l;j=1,⋯,l;i=jZijx+Zijy+Zjix+Zjiy≥1,i=1,⋯,l;j=1,⋯,l;i<jyi≥ai,i=1,⋯,lxi≥0,i=1,⋯,lZijx,Zijy=0,1,i=1,⋯,l;j=1,⋯,l;i=j
其中
p
i
,
a
i
,
b
i
,
d
i
,
l
i
,
c
1
i
,
c
2
i
p_i,a_i,b_i,d_i,l_i,c_{1i},c_{2i}
pi,ai,bi,di,li,c1i,c2i均为随机生成的参数
defcreatePara(l):'''
用df存储随机生成的参数
Args:
l (int): number of vessels
Returns:
dataframe: 参数表格
'''
df = pd.DataFrame()# 创建一个空dataframe(空表格)
df['vessel']=list(range(l))# 船只的编号:0-l-1, 共l搜船只# random.randint(x,y): 生成一个x到y之间的随机整数# [random.randint(x,y) for i in range(l)]: 生成一个长度为l的列表,列表中的元素均为x到y之间的随机整数# df['列名'] = 列表: 将列表赋值给df的列
df['p_i']=[
random.randint(0,550)for i inrange(l)]# best berth location of vessel i
df['a_i']=[
random.randint(0,75)for i inrange(l)]# expected arrival time of vessel i
df['b_i']=[
random.randint(6,11)for i inrange(l)]# ship operational time required for vessel i
df['d_i']=[
random.randint(0,100)for i inrange(l)]# requested departure time of vessel i
df['l_i']=[random.randint(150,300)for i inrange(l)]# length of vessel i
df['c_{1i}']=[
random.randint(5,9)for i inrange(l)]# additonal travel cost of vessel i
df['c_{2i}']=[random.randint(5,9)for i inrange(l)]# penalty cost of vessel ireturn df
createVar(l)函数根据船只数生成对应变量(根据模型,船只数变化时,变量数量是要变化的)
defcreateVar(l):'''
创建变量
Args:
l (int): number of vessels
Returns:
list: 每个列表存储不同种类的变量
'''
x_variables =['x_'+str(i)for i inrange(l)]# berth location of vessel i
y_variables =['y_'+str(i)for i inrange(l)]# berthing time of vessel i
zx_variables =[[f'zx_{i}{j}'for j inrange(l)]for i inrange(l)]# zx_{ij} = 1 if vessel i located to the left_hand of vessel j
zy_variables =[[f'zy_{i}{j}'for j inrange(l)]for i inrange(l)]# zy_{ij} = 1 if vessel i located below vessel j
abs_variables =[f'abs_{i}'for i inrange(l)]# 目标函数中有绝对值, 然而线性规划中是不支持绝对值的, 所以需要新增一个变量来代替绝对值return x_variables, y_variables, zx_variables, zy_variables, abs_variables
defcreatePulpVar(x_variables, y_variables, zx_variables, zy_variables, abs_variables):'''
将变量转换为pulp变量
直接创建变量是不能用在pulp中的, 需要将变量转换为pulp的变量, 在目标函数和约束条件中必须使用pulp变量
Args:
x_variables (lsit): berth location
y_variables (list): berthing time
zx_variables (list): if vessel i located to the left_hand of vessel j
zy_variables (list): if vessel i located below vessel j
abs_variables (list): a variable to replace the absolute value
'''# lowBound=0: 变量的下界为0, cat='Integer': 变量的类型为整数, cat='Binary': 变量值为0或1
BerthLocation = pulp.LpVariable.dicts('BerthLocation', x_variables, lowBound=0, cat='Integer')# 将x_variables转换为pulp变量
BerthTime = pulp.LpVariable.dicts('BerthTime', y_variables, lowBound=0, cat='Integer')# 将y_variables转换为pulp变量
LeftSide = pulp.LpVariable.dicts('LeftSide',[item for row in zx_variables for item in row],
lowBound=0,
cat='Binary',)# 将zx_variables转换为pulp变量
Below = pulp.LpVariable.dicts('Below',[item for row in zy_variables for item in row],
lowBound=0,
cat='Binary',)# 将zy_variables转换为pulp变量
Abs = pulp.LpVariable.dicts('Abs', abs_variables, lowBound=0, cat='Integer')# 将abs_variables转换为pulp变量return BerthLocation, BerthTime, LeftSide, Below, Abs
main(l)主函数, 输入船只数, 调用上述函数, 生成模型并进行求解
defmain(l):'''
线性规划模型
Args:
l (int): number of vessels
'''
model = pulp.LpProblem('BerthAllocation', pulp.LpMinimize)# 用dataframe存储随机生成的系数
df = createPara(l)# 随机生成参数print('参数列表:')print(df)# 打印随机生成的参数
x_variables, y_variables, zx_variables, zy_variables, abs_variables = createVar(
l
)# 创建变量
BerthLocation, BerthTime, LeftSide, Below, Abs = createPulpVar(
x_variables, y_variables, zx_variables, zy_variables, abs_variables
)# 将变量转换为pulp变量# 创建目标函数
model += pulp.lpSum([
df.iloc[i,6]*(Abs[abs_variables[i]])# 使用绝对值变量代替|x_i-p_i|, 并在约束中增加对绝对值变量的约束保证取到了绝对值+ df.iloc[i,7]*(BerthTime[y_variables[i]]+ df.iloc[i,3]- df.iloc[i,4])for i inrange(l)])# 增加约束for i inrange(l):# 绝对值变量约束: 绝对值变量要大于等于(x_i-p_i)和(p_i-x_i), 从而保证取到了绝对值
model +=(
Abs[abs_variables[i]]>= BerthLocation[x_variables[i]]- df.iloc[i,1])# 绝对值变量要大于等于(x_i-p_i)
model +=(
Abs[abs_variables[i]]>=-BerthLocation[x_variables[i]]+ df.iloc[i,1])# 绝对值变量要大于等于(p_i-x_i)# 其他约束# x_i >= 0 和 zx_ij, zy_ij 只能为0或1 在定义变量时已经限制了, 约束中不需要写了
model += BerthLocation[x_variables[i]]+ df.iloc[i,5]<= L # x_i + l_i <= L
model += BerthTime[y_variables[i]]>= df.iloc[i,2]# y_i >= a_i
model +=(
BerthTime[y_variables[i]]+ df.iloc[i,3]- df.iloc[i,4]>=0)# y_i + b_i - d_i >= 0 (目标函数中的加号项)for j inrange(l):if i < j:
model +=(
LeftSide[zx_variables[i][j]]+ Below[zy_variables[i][j]]+ LeftSide[zx_variables[j][i]]+ Below[zy_variables[j][i]]>=1)# zx_ij + zy_ij + zx_ji + zy_ji >= 1if i != j:
model +=(
BerthLocation[x_variables[i]]+ df.iloc[i,5]<= BerthLocation[x_variables[j]]+(1- LeftSide[zx_variables[i][j]])* M
)# x_i + l_i <= x_j + M * (1-zx_ij)
model +=(
BerthTime[y_variables[i]]+ df.iloc[i,3]<= BerthTime[y_variables[j]]+(1- Below[zy_variables[i][j]])* M
)# y_i + t_i <= y_j + M * (1-zy_ij)
model.solve(
pulp.apis.PULP_CBC_CMD(msg=False))# 求解线性规划模型(pulp.apis.PULP_CBC_CMD(msg=False)的作用为不显示log)print("求解状态:", pulp.LpStatus[model.status])# 打印求解状态, Optimal: 存在最优解; Infeasible: 无解if pulp.LpStatus[model.status]=='Optimal':# 若有最优解, 则打印最优解并绘制图像
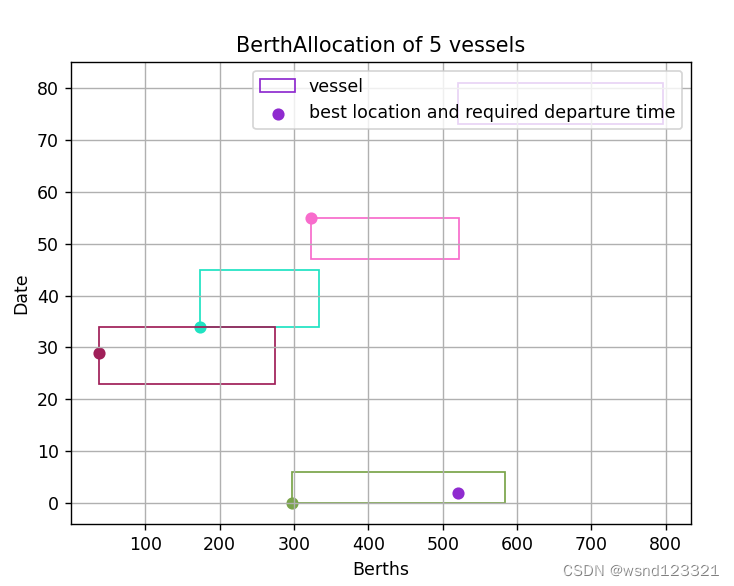
draw(model, l, df)print("最优总成本 = ", pulp.value(model.objective))


 798
798


 被折叠的 条评论
为什么被折叠?
被折叠的 条评论
为什么被折叠?
 到【灌水乐园】发言


