


文档树懒学堂:ECharts visualMap 代码实例及对应注释 - 树懒学堂


封装的echarts 组件代码:
<template>
<div :style="{ height: '100%' }">
<div class="foldLine" ref="foldLine" :style="{ width: widths, height: heights }"></div>
</div>
</template>
<script>
import * as echarts from 'echarts';
export default {
props: {
id: {
type: String,
default: 'lineEchartNew'
},
heights: {
type: String,
default: '100%'
},
widths: {
type: String,
default: '100%'
},
tagName: {
type: String,
default: '排名'
},
indexName: {
type: String,
default: ''
},
chartObj: {
type: Array,
default: () => {
return [];
}
},
objs: {
type: Object,
default: () => {
return {
height: '100%'
};
}
}
},
data() {
return {
chart: null
};
},
watch: {
chartObj: {
handler() {
this.initEchats();
},
deep: true
}
},
mounted() {
this.$nextTick(() => {
this.init();
});
},
beforeDestroy() {
this.chart && this.chart.dispose();
this.chart = null;
},
methods: {
init() {
this.chart = echarts.init(this.$refs.foldLine);
this.initEchats();
},
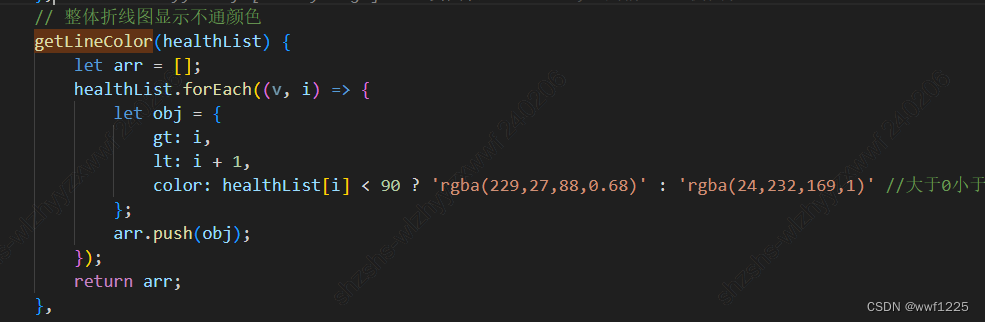
// 整体折线图显示不通颜色
getLineColor(healthList) {
let arr = [];
healthList.forEach((v, i) => {
let obj = {
gt: i,
lt: i + 1,
color: healthList[i] < 90 ? 'rgba(229,27,88,0.68)' : 'rgba(24,232,169,1)' //大于0小于12为绿色
};
arr.push(obj);
});
return arr;
},
initEchats() {
let xDataList = []; // x轴
let healthList = []; // 整体
let xzHealthList = []; // 修障
let zyHealthList = []; // 装移
let zycolorList = []; // 装移
let xzcolorList = []; // 修障
let isColor = ''; // 整体
//isColor == 1 说明低于90分 红色: #F32B2B
this.chartObj &&
this.chartObj.forEach((v, index) => {
xDataList.push(v.region);
// 整体
if (v.isColor == 0) {
isColor = 'rgba(24,232,169,1)';
} else if (v.isColor == 1) {
isColor = '#F32B2B'; // 红色
// isColor = 'rgba(24,232,169,1)';
}
// 装移
if (v.zyIsColor == 0) {
zycolorList[index] = ['#1EE7E7', 'rgba(30, 231, 231, 0.35)'];
} else if (v.zyIsColor == 1) {
zycolorList[index] = ['rgba(243, 43, 43, 0)', '#F32B2B'];
}
// 修障
if (v.xzIsColor == 0) {
xzcolorList[index] = ['#1890FF', 'rgba(24, 144, 255, 0.35)'];
} else if (v.xzIsColor == 1) {
xzcolorList[index] = ['rgba(243, 43, 43, 0)', '#F32B2B'];
}
if (!this.tagName || this.tagName == '排名') {
healthList.push(v.score);
xzHealthList.push(v.xzscore);
zyHealthList.push(v.zyscore);
this.legendData = [
{
show: true,
top: -3,
right: 110,
itemWidth: 10,
itemHeight: 2,
data: [
{
name: '整体',
icon: 'rect'
}
],
itemStyle: {
color: '#18E8A9'
},
textStyle: {
fontSize: 12,
lineHeight: 12,
color: '#fff',
rich: {
a: {
verticalAlign: 'middle'
}
},
padding: [0, 0, -2, 0] //[上、右、下、左]
}
},
{
show: true,
top: -3,
right: 60,
itemWidth: 10,
itemHeight: 10,
data: [{ name: '装移', icon: 'rect' }],
textStyle: {
fontSize: 12,
lineHeight: 12,
color: '#fff',
rich: {
a: {
verticalAlign: 'middle'
}
},
padding: [0, 0, -2, 0] //[上、右、下、左]
}
},
{
show: true,
top: -3,
right: 10,
itemWidth: 10,
itemHeight: 10,
data: [{ name: '修障', icon: 'rect' }],
textStyle: {
fontSize: 12,
lineHeight: 12,
color: '#fff',
rich: {
a: {
verticalAlign: 'middle'
}
},
padding: [0, 0, -2, 0] //[上、右、下、左]
}
}
];
if (this.indexName == '交付转化') {
this.legendData = [
{
show: true,
top: -3,
right: 10,
itemWidth: 10,
itemHeight: 10,
data: [{ name: '交付', icon: 'rect' }],
textStyle: {
fontSize: 12,
lineHeight: 12,
color: '#fff',
rich: {
a: {
verticalAlign: 'middle'
}
},
padding: [0, 0, -2, 0] //[上、右、下、左]
}
}
];
}
if (this.indexName == '修障重复申告率') {
this.legendData = [
{
show: true,
top: -3,
right: 10,
itemWidth: 10,
itemHeight: 10,
data: [{ name: '修障', icon: 'rect' }],
textStyle: {
fontSize: 12,
lineHeight: 12,
color: '#fff',
rich: {
a: {
verticalAlign: 'middle'
}
},
padding: [0, 0, -2, 0] //[上、右、下、左]
}
}
];
}
} else if (this.tagName == '整体') {
healthList.push(v.overall);
xzHealthList.push(v.xz);
zyHealthList.push(v.zy);
this.legendData = [
{
show: true,
top: -3,
right: 110,
itemWidth: 10,
itemHeight: 2,
data: [
{
name: '整体',
icon: 'rect'
}
],
itemStyle: {
color: '#18E8A9'
},
textStyle: {
fontSize: 12,
lineHeight: 12,
color: '#fff',
rich: {
a: {
verticalAlign: 'middle'
}
},
padding: [0, 0, -2, 0] //[上、右、下、左]
}
},
{
show: true,
top: -3,
right: 60,
itemWidth: 10,
itemHeight: 10,
data: [{ name: '装移', icon: 'rect' }],
textStyle: {
fontSize: 12,
lineHeight: 12,
color: '#fff',
rich: {
a: {
verticalAlign: 'middle'
}
},
padding: [0, 0, -2, 0] //[上、右、下、左]
}
},
{
show: true,
top: -3,
right: 10,
itemWidth: 10,
itemHeight: 10,
data: [{ name: '修障', icon: 'rect' }],
textStyle: {
fontSize: 12,
lineHeight: 12,
color: '#fff',
rich: {
a: {
verticalAlign: 'middle'
}
},
padding: [0, 0, -2, 0] //[上、右、下、左]
}
}
];
if (this.indexName == '交付转化') {
this.legendData = [
{
show: true,
top: -3,
right: 10,
itemWidth: 10,
itemHeight: 10,
data: [{ name: '交付', icon: 'rect' }],
textStyle: {
fontSize: 12,
lineHeight: 12,
color: '#fff',
rich: {
a: {
verticalAlign: 'middle'
}
},
padding: [0, 0, -2, 0] //[上、右、下、左]
}
}
];
}
if (this.indexName == '修障重复申告率') {
this.legendData = [
{
show: true,
top: -3,
right: 10,
itemWidth: 10,
itemHeight: 10,
data: [{ name: '修障', icon: 'rect' }],
textStyle: {
fontSize: 12,
lineHeight: 12,
color: '#fff',
rich: {
a: {
verticalAlign: 'middle'
}
},
padding: [0, 0, -2, 0] //[上、右、下、左]
}
}
];
}
} else if (this.tagName == '交付') {
healthList = [];
xzHealthList = [];
zyHealthList.push(v.zy);
this.legendData = [
{
show: true,
top: -3,
right: 10,
itemWidth: 10,
itemHeight: 10,
data: [{ name: this.indexName == '交付转化' ? '交付' : '装移', icon: 'rect' }],
textStyle: {
fontSize: 12,
lineHeight: 12,
color: '#fff',
rich: {
a: {
verticalAlign: 'middle'
}
},
padding: [0, 0, -2, 0] //[上、右、下、左]
}
}
];
} else if (this.tagName == '申告') {
healthList = [];
zyHealthList = [];
xzHealthList.push(v.xz);
this.legendData = [
{
show: true,
top: -3,
right: 10,
itemWidth: 10,
itemHeight: 10,
data: [{ name: this.indexName == '交付转化' ? '交付' : '修障', icon: 'rect' }],
textStyle: {
fontSize: 12,
lineHeight: 12,
color: '#fff',
rich: {
a: {
verticalAlign: 'middle'
}
},
padding: [0, 0, -2, 0] //[上、右、下、左]
}
}
];
}
});
let seriesAll = [
{
name: '整体',
type: 'line',
// barWidth: 24,
barGap: '1%',
// symbol: 'rect',
symbolSize: [0, 0],
data: healthList,
// label: {
// normal: {
// show: true,
// fontSize: 14,
// color: '#fff',
// formatter: '{c}',
// position: 'top'
// }
// },
itemStyle: {
color: 'rgba(24,232,169,1)',
// color: isColor,
borderColor: '#18E8A9',
borderWidth: 1,
borderType: 'solid'
}
},
{
name: '装移',
type: 'bar',
barWidth: 5,
barGap: '1%',
data: zyHealthList,
itemStyle: {
normal: {
//这里设置每个柱子颜色不一样
color: function (params) {
let colorItem = zycolorList[params.dataIndex];
if (colorItem !== undefined) {
return new echarts.graphic.LinearGradient(
0,
0,
0,
1,
[
{
offset: 0,
color: colorItem[0]
},
{
offset: 1,
color: colorItem[1]
}
],
false
);
}
}
}
}
// color: new echarts.graphic.LinearGradient(0, 0, 0, 1, [
// {
// offset: 0,
// color: '#1EE7E7 '
// },
// {
// offset: 1,
// color: 'rgba(30, 231, 231, 0.35)'
// }
// ])
},
{
name: '修障',
type: 'bar',
barWidth: 5,
barGap: '1%',
data: xzHealthList,
itemStyle: {
normal: {
//这里设置每个柱子颜色不一样
color: function (params) {
let colorItem = xzcolorList[params.dataIndex];
if (colorItem !== undefined) {
return new echarts.graphic.LinearGradient(
0,
0,
0,
1,
[
{
offset: 0,
color: colorItem[0]
},
{
offset: 1,
color: colorItem[1]
}
],
false
);
}
}
}
}
// color: new echarts.graphic.LinearGradient(0, 0, 0, 1, [
// {
// offset: 0,
// color: '#1890FF '
// },
// {
// offset: 1,
// color: 'rgba(24, 144, 255, 0.35)'
// }
// ])
}
];
let seriesJiaoFu = [
{
name: '交付',
type: 'bar',
barWidth: 5,
barGap: '1%',
data: zyHealthList,
color: new echarts.graphic.LinearGradient(0, 0, 0, 1, [
{
offset: 0,
color: '#1EE7E7 '
},
{
offset: 1,
color: 'rgba(30, 231, 231, 0.35)'
}
])
}
];
let axisLabelAll = {
color: 'rgba(230,247,255,0.85)',
interval: 0, //0: x轴名字没有间隔隐藏,全部显示
fontSize: 10,
// rotate: 40, // 调整数值改变倾斜的幅度(范围-90到90)
formatter: (text) => {
return text.replaceAll('分公司', '');
}
};
let axisLabelMore = {
color: 'rgba(230,247,255,0.85)',
// interval: 0, //0: x轴名字没有间隔隐藏,全部显示
fontSize: 10
};
let option = {
tooltip: {
trigger: 'axis',
axisPointer: {
// 坐标轴指示器,坐标轴触发有效 设置鼠标放上去是线还是阴影
type: 'shadow' // 默认为直线,可选为:'line' | 'shadow'
}
// formatter:function(param){
// if(param.length>2){
// return `
// <p>时间:${param[0].name}</p>
// <p>${param[0].seriesName}:能耗${param[0].data},PRB利用率:${param[1].data}</p>
// <p>${param[2].seriesName}:能耗:${param[2].data},PRB利用率:${param[3].data}</p>
// `
// }else{
// return `
// <p>时间:${param[0].name}</p>
// <p>${param[0].seriesName}:能耗${param[0].data},PRB利用率:${param[1].data}</p>
// `
// }
// }
},
legend: this.legendData,
grid: {
top: '16%',
left: '3%',
right: '5%',
bottom: '7%',
containLabel: true
},
yAxis: {
name: '',
nameTextStyle: {
color: '#fff',
align: 'center'
},
nameGap: 20,
type: 'value',
splitLine: {
show: true,
lineStyle: {
//轴线样式
type: 'dashed', // dotted
color: 'rgba(230, 247, 255, 0.2)'
}
},
axisLine: {
//坐标轴轴线
show: false, //是否显示
lineStyle: {
//轴线样式
color: '#656A94'
}
},
axisTick: {
show: false //是否显示刻度
},
axisLabel: {
inside: false, //数值内侧外侧
// padding: [0, 4, 15, 0],
showMinLabel: true,
showMaxLabel: true,
color: 'rgba(230,247,255,0.6)',
fontSize: 12
// formatter:function(text,index){
// return text+"%";
// }
}
},
xAxis: [
{
type: 'category',
data: xDataList,
axisLine: {
lineStyle: {
color: '#E6F7FF'
}
},
axisTick: {
show: false
},
// axisLabel: {
// color: 'rgba(230,247,255,0.85)',
// interval: 0, //0: x轴名字没有间隔隐藏,全部显示
// fontSize: 10,
// // rotate: 40, // 调整数值改变倾斜的幅度(范围-90到90)
// formatter: (text) => {
// return text.replaceAll('分公司', '');
// }
// }
axisLabel: xDataList.length > 12 ? axisLabelMore : axisLabelAll
},
{
type: 'category',
axisLine: {
show: false
},
axisTick: {
show: false
},
axisLabel: {
show: false
}
}
],
series: this.indexName == '交付转化' ? seriesJiaoFu : seriesAll,
// 一条折线图显示不通颜色
visualMap:
this.indexName == '交付转化'
? null
: {
type: 'piecewise',
show: false,
dimension: 0,
seriesIndex: 0,
pieces: this.getLineColor(healthList)
// pieces: [
// {
// gt: 0,
// lt: 1,
// color: healthList[0] < 90 ? 'rgba(229,27,88,0.68)' : 'rgba(24,232,169,1)' //大于0小于12为绿色
// },
// {
// gt: 1,
// lt: 2,
// color: healthList[1] < 90 ? 'rgba(229,27,88,0.68)' : 'rgba(24,232,169,1)' //大于0小于12为绿色
// },
// ]
}
};
if (option && typeof option === 'object') {
this.chart.clear(); //画布清空
this.chart.resize(); //自适应div的大小
this.chart.setOption(option, true);
// this.chart.setOption(
// {
// series: seriesArr
// },
// { notMerge: false, lazyUpdate: false, silent: false }
// );
}
}
}
};
</script>
<style lang="scss" scoped></style>


 1万+
1万+

 被折叠的 条评论
为什么被折叠?
被折叠的 条评论
为什么被折叠?
 到【灌水乐园】发言


