


 本文介绍了如何使用ECharts实现一个自定义的人才九宫格展示,通过JavaScript进行前端开发,详细讲解了相关代码实现和初始化方法,最终展示了实际效果。
需求:
实现代码:
标签:
<div id="quadrant" style="width:250px; height:250px;background-color:grey;"></div>
初始化方法:
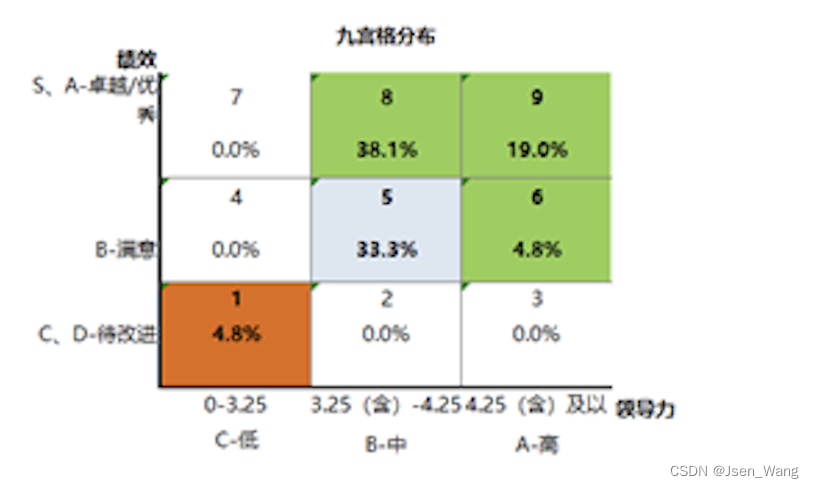
/*九宫格分布*/
    setupQuadrant() {
      let quadrantDom = document.getElementById('quadrant')
      let quadrantChart = echarts.init(quadrantDom)

      const fgX = 58;
      const fgY = 160
      const spW = 67
      const spH = 40
      let quadrantOption = {
        xAxis: {
          show: true,
          position: 'bottom',
          type: 'category',
          name: '领\n导\n力',
          nameTextStyle: {
            align: 'center',
            color: '#000',
          },
          axisLine: {
            lineStyle: {
              color: '#000'
            },
          },
          axisLabel: {
            color: '#000'
          },
          axisTick: {
            color:'#000',
            lineStyle: {
              color: '#000'
            }
          },
          interval: 3,
          // data: ['0-3.25\nC-低','3.25(含)-4.25\nB-中','4.25(含)及以上\nA-高']
          data: ['C-低','B-中','A-高'],
          boundaryGap: ['20%', '20%']

        },
        yAxis: {
          show: true,
          position: 'start',
          type: 'category',
          name: '绩效',
          axisLine: {
            lineStyle: {
              color: '#000'
            },
          },
          nameTextStyle: {
            color: '#000',
          },
          axisLabel: {
            color: '#000'
          },
          axisTick: {
            color:'#000',
            lineStyle: {
              color: '#000'
            }
          },
          // offset: -20,
          data: ['C\nD','B','S\nA']
        },
        graphic: [
          {
            type: 'group',
            children: [
              {
                id: '1',
                type: 'group',
                x: fgX,
                y: fgY,
                children: [
                  {
                    id: '1.1',
                    type: 'rect',
                    left: 'center', // 相对父元素居中
                    top: 'middle',  // 相对父元素居中
                    shape: {
                      width: spW,
                      height: spH
                    },
                    style: {
 最低0.47元/天 解锁文章


 2226
2226

 被折叠的 条评论
为什么被折叠?
被折叠的 条评论
为什么被折叠?
 到【灌水乐园】发言


