


1. 环境要求
需要JDK 1.5或更高版本。
2. 下载与安装
从JStockChart的站点中下载它的最新版本,当前版本是0.4.2。
解压JStockChart的zip文件(jstockchart-0.4.2.zip)后,将jstockchart目录中的jstockchart-0.4.2.jar和jstockchart/lib目录中的jcommon-1.0.16.jar和jfreechart-1.0.13.jar加到classpath中。
3. 示例
在JStockChart的发行包中,有一个demo目录。该目录包含了一个简单的例子,展示了如何利用JStockChart去生成时序图。demo目录中有一个Ant脚本build.xml,在该目录下执行命令ant即可运行该示例程序。下面是该示例的关键代码及其说明。
4. 定制图表
由于JFreeChart具有高度的可定制性,所以当生成了JFreeChart实例后,你可以从中获取图表中的各个元素,如Plot,然后再定制它们的属性。详细信息请参见JFreeChart的站点和论坛。
另外,在创建JStockChart的XXXArea对象时,也可以直接定制若干属性。如,通过PriceArea类,可以设置价格线的颜色(PriceArea.setPriceColor),均线的颜色(PriceArea.setAverageColor);是否显示均线(PriceArea.setAverageVisible);是否显示涨跌幅(PriceArea.setRateVisible);...。详细信息请参见JStockChart的API文档。
需要JDK 1.5或更高版本。
2. 下载与安装
从JStockChart的站点中下载它的最新版本,当前版本是0.4.2。
解压JStockChart的zip文件(jstockchart-0.4.2.zip)后,将jstockchart目录中的jstockchart-0.4.2.jar和jstockchart/lib目录中的jcommon-1.0.16.jar和jfreechart-1.0.13.jar加到classpath中。
3. 示例
在JStockChart的发行包中,有一个demo目录。该目录包含了一个简单的例子,展示了如何利用JStockChart去生成时序图。demo目录中有一个Ant脚本build.xml,在该目录下执行命令ant即可运行该示例程序。下面是该示例的关键代码及其说明。
public
class
TimeseriesChartDemo {
public static void main(String[] args) throws IOException {
//
// 创建一个包含TimeseriesItem的List实例。
// 在此处,通过查询db4o的数据库文件,直接获得该List.
// 注意:所有的数据,都必须在"同一天"内。
List data =;
// 创建SegmentedTimeline实例,表示时间区间"00:00-11:30,13:00-24:00"(即24小时中空缺了"11:31-12:59"这段时间)。
SegmentedTimeline timeline = new SegmentedTimeline(
SegmentedTimeline.MINUTE_SEGMENT_SIZE, 1351 , 89 );
timeline.setStartTime(SegmentedTimeline.firstMondayAfter1900()
+ 780 * SegmentedTimeline.MINUTE_SEGMENT_SIZE);
// 创建TimeseriesDataset实例,时间间隔为1分钟。
TimeseriesDataset dataset = new TimeseriesDataset(Minute. class , 1 , timeline, true );
// 向dataset中加入TimeseriesItem的List。
dataset.addDataItems(data);
// 创建逻辑价格坐标轴。指定中间价为21,显示9个坐标值,坐标值的格式为".00"。
CentralValueAxis fixedPriceAxis = new CentralValueAxis( new Double( " 21 " ), new Range(
dataset.getMinPrice().doubleValue(), dataset.getMaxPrice().doubleValue()),
9 , new DecimalFormat( " .00 " ));
// 创建价格区域
PriceArea priceArea = new PriceArea(fixedPriceAxis);
// 创建逻辑量坐标轴。显示5个坐标值,坐标值的格式为"0"。
FixedNumberAxis fixedVolumeAxis = new FixedNumberAxis( new Range(dataset
.getMinVolume().doubleValue(), dataset.getMaxVolume()
.doubleValue()), 5 , new DecimalFormat( " 0 " ));
// 创建量区域
VolumeArea volumeArea = new VolumeArea(fixedVolumeAxis);
// 创建时序图区域
TimeseriesArea timeseriesArea = new TimeseriesArea(priceArea,
volumeArea, createFixedDateAxis(DateUtils.createDate( 2008 , 1 , 1 )));
// 通过JStockChartFactory的工厂方法生成JFreeChart实例。
// 指定了该图的标题为"Timeseries Chart Demo",并且不生成图例(legend)。
JFreeChart jfreechart = JStockChartFactory.createTimeseriesChart(
" Timeseries Chart Demo " , dataset, timeline, timeseriesArea, false );
// 创建图像文件。图像格式为PNG,长为545,宽为300。
ChartUtilities.saveChartAsPNG( new File(imageFile), jfreechart, 545 , 300 );
}
// 指定时期坐标轴中的逻辑坐标。
private static FixedDateAxis createFixedDateAxis(Date baseDate) {
FixedDateAxis fixedDateAxis = new FixedDateAxis(baseDate,
new SimpleDateFormat( " HH:mm " ));
fixedDateAxis.addDateTick( " 09:30 " , TickAlignment.START);
fixedDateAxis.addDateTick( " 10:00 " );
fixedDateAxis.addDateTick( " 10:30 " );
fixedDateAxis.addDateTick( " 11:00 " );
fixedDateAxis.addDateTick( " 11:30 " , TickAlignment.END);
fixedDateAxis.addDateTick( " 13:00 " , TickAlignment.START);
fixedDateAxis.addDateTick( " 13:30 " );
fixedDateAxis.addDateTick( " 14:00 " );
fixedDateAxis.addDateTick( " 14:30 " );
fixedDateAxis.addDateTick( " 15:00 " , TickAlignment.END);
return fixedDateAxis;
}
}
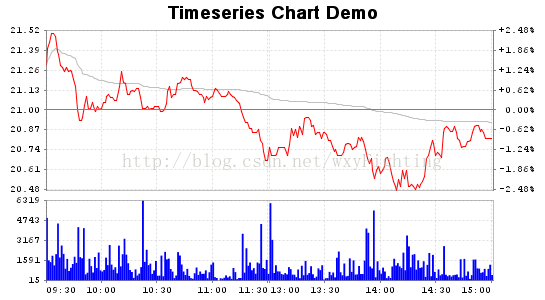
运行该示例程序后,可以生成如下图片:public static void main(String[] args) throws IOException {
//
// 创建一个包含TimeseriesItem的List实例。
// 在此处,通过查询db4o的数据库文件,直接获得该List.
// 注意:所有的数据,都必须在"同一天"内。
List data =
;// 创建SegmentedTimeline实例,表示时间区间"00:00-11:30,13:00-24:00"(即24小时中空缺了"11:31-12:59"这段时间)。
SegmentedTimeline timeline = new SegmentedTimeline(
SegmentedTimeline.MINUTE_SEGMENT_SIZE, 1351 , 89 );
timeline.setStartTime(SegmentedTimeline.firstMondayAfter1900()
+ 780 * SegmentedTimeline.MINUTE_SEGMENT_SIZE);
// 创建TimeseriesDataset实例,时间间隔为1分钟。
TimeseriesDataset dataset = new TimeseriesDataset(Minute. class , 1 , timeline, true );
// 向dataset中加入TimeseriesItem的List。
dataset.addDataItems(data);
// 创建逻辑价格坐标轴。指定中间价为21,显示9个坐标值,坐标值的格式为".00"。
CentralValueAxis fixedPriceAxis = new CentralValueAxis( new Double( " 21 " ), new Range(
dataset.getMinPrice().doubleValue(), dataset.getMaxPrice().doubleValue()),
9 , new DecimalFormat( " .00 " ));
// 创建价格区域
PriceArea priceArea = new PriceArea(fixedPriceAxis);
// 创建逻辑量坐标轴。显示5个坐标值,坐标值的格式为"0"。
FixedNumberAxis fixedVolumeAxis = new FixedNumberAxis( new Range(dataset
.getMinVolume().doubleValue(), dataset.getMaxVolume()
.doubleValue()), 5 , new DecimalFormat( " 0 " ));
// 创建量区域
VolumeArea volumeArea = new VolumeArea(fixedVolumeAxis);
// 创建时序图区域
TimeseriesArea timeseriesArea = new TimeseriesArea(priceArea,
volumeArea, createFixedDateAxis(DateUtils.createDate( 2008 , 1 , 1 )));
// 通过JStockChartFactory的工厂方法生成JFreeChart实例。
// 指定了该图的标题为"Timeseries Chart Demo",并且不生成图例(legend)。
JFreeChart jfreechart = JStockChartFactory.createTimeseriesChart(
" Timeseries Chart Demo " , dataset, timeline, timeseriesArea, false );
// 创建图像文件。图像格式为PNG,长为545,宽为300。
ChartUtilities.saveChartAsPNG( new File(imageFile), jfreechart, 545 , 300 );
}
// 指定时期坐标轴中的逻辑坐标。
private static FixedDateAxis createFixedDateAxis(Date baseDate) {
FixedDateAxis fixedDateAxis = new FixedDateAxis(baseDate,
new SimpleDateFormat( " HH:mm " ));
fixedDateAxis.addDateTick( " 09:30 " , TickAlignment.START);
fixedDateAxis.addDateTick( " 10:00 " );
fixedDateAxis.addDateTick( " 10:30 " );
fixedDateAxis.addDateTick( " 11:00 " );
fixedDateAxis.addDateTick( " 11:30 " , TickAlignment.END);
fixedDateAxis.addDateTick( " 13:00 " , TickAlignment.START);
fixedDateAxis.addDateTick( " 13:30 " );
fixedDateAxis.addDateTick( " 14:00 " );
fixedDateAxis.addDateTick( " 14:30 " );
fixedDateAxis.addDateTick( " 15:00 " , TickAlignment.END);
return fixedDateAxis;
}
}
4. 定制图表
由于JFreeChart具有高度的可定制性,所以当生成了JFreeChart实例后,你可以从中获取图表中的各个元素,如Plot,然后再定制它们的属性。详细信息请参见JFreeChart的站点和论坛。
另外,在创建JStockChart的XXXArea对象时,也可以直接定制若干属性。如,通过PriceArea类,可以设置价格线的颜色(PriceArea.setPriceColor),均线的颜色(PriceArea.setAverageColor);是否显示均线(PriceArea.setAverageVisible);是否显示涨跌幅(PriceArea.setRateVisible);...。详细信息请参见JStockChart的API文档。


 723
723


 被折叠的 条评论
为什么被折叠?
被折叠的 条评论
为什么被折叠?
 到【灌水乐园】发言


