


 本文详细介绍了如何在Qt项目中下载并安装QCustomPlot库,以及如何进行基本的控件配置、坐标轴设置、图形绘制、图例管理和数据添加。
1、QcustomPlot下载和安装
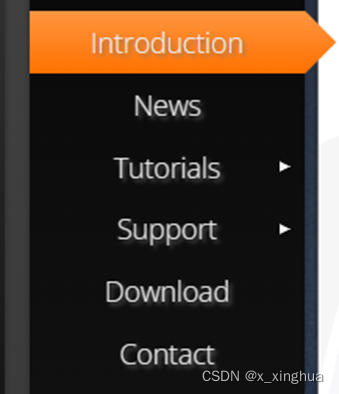
官方链接:Qt Plotting Widget QCustomPlot - Introduction
(1)点击【Download】
(2)点击下载【Qcustomplot.tar.gz】
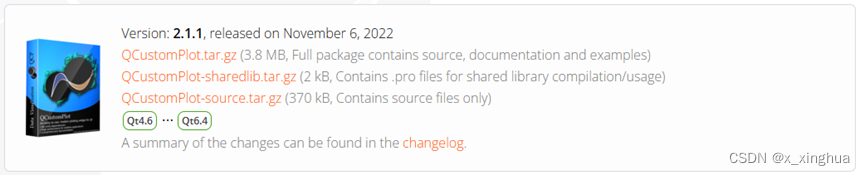
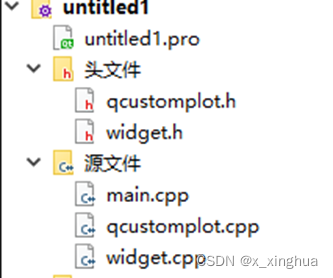
(3)将解压后的qcustomplot.h和qcustomplot.cpp添加到工程中
(4)在.pro文件中添加变量printsupport
greaterThan(QT_MAJOR_VERSION, 4): QT += widgets printsupport2、QcustomPlot的使用
(1)在使用qcustomplot的文件中添加包含头文件
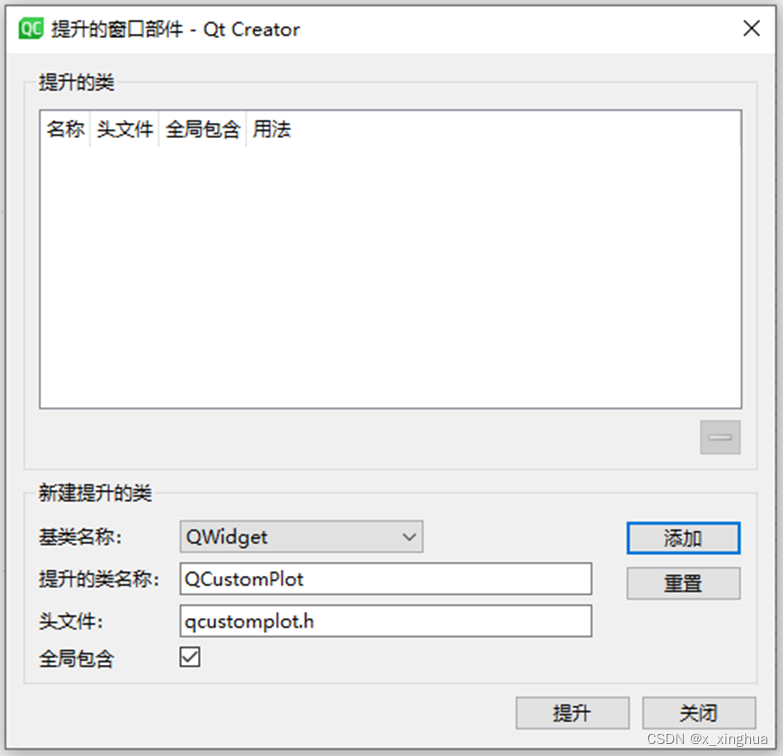
#include "qcustomplot.h"(2)提升控件类:
选择【提升为】
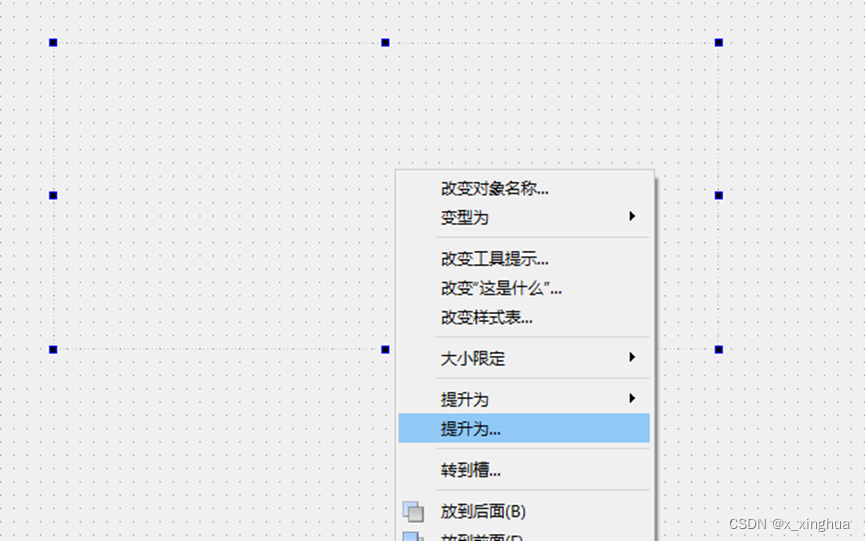
然后在提升类的名称中输入QcustomPlot,然后点击【添加】将QcustomPlot加入到提升类列表中,最后点击【提升】
3、基本绘制
设置表名
//设置表名
ui->customplot->plotLayout()->insertRow(0);
QCPTextElement *title = new QCPTextElement(ui->customplot, "Channels", QFont("sans", 15, QFont::Bold));
ui->customplot->plotLayout()->addElement(0,0,title);
title->setTextColor(QColor(255,255,255));
设置图表背景颜色
//图表背景设置透明
    ui->customplot->setBackground(QColor(255,255,255,0));
设置座标售颜色和线宽
//坐标轴颜色和线宽
    ui->customplot->xAxis->setBasePen(QPen(Qt::white,1));
    ui->customplot->xAxis2->setBasePen(QPen(Qt::white,1));
    ui->customplot->yAxis->setBasePen(QPen(Qt::white,1));
    ui->customplot->yAxis2->setBasePen(QPen(Qt::white,1));
设置主刻度颜色及线宽
ui->customplot->xAxis->setTickPen(QPen(Qt::white,1));
ui->customplot->xAxis2->setTickPen(QPen(Qt::white,1));
ui->customplot->yAxis->setTickPen(QPen(Qt::white,1));
ui->customplot->yAxis2->setTickPen(QPen(Qt::white,1));
设置子刻度颜色及线宽
//子刻度颜色
    ui->customplot->xAxis->setSubTickPen(QPen(Qt::white,1));
    ui->customplot->xAxis2->setSubTickPen(QPen(Qt::white,1));
    ui->customplot->yAxis->setSubTickPen(QPen(Qt::white,1));
    ui->customplot->yAxis2->setSubTickPen(QPen(Qt::white,1));
设置坐标轴刻度字体颜色
//坐标轴刻度字体颜色
    ui->customplot->xAxis->setTickLabelColor(QColor(255,255,255));
    ui->customplot->yAxis->setTickLabelColor(QColor(255,255,255));
设置坐标轴范围
//坐标轴范围设置
    ui->customplot->yAxis->setRange(-20,600);
    ui->customplot->xAxis->setRange(0,40);
设置坐标轴标题
//坐标轴标题设置
    ui->customplot->xAxis->setLabel(QObject::tr("时间(s)"));
    ui->customplot->yAxis->setLabel(QObject::tr("压力(mmHg)"));
设置坐标轴标题字体颜色
//坐标轴标题字体颜色设置
    ui->customplot->xAxis->setLabelColor(QColor(255,255,255));
    ui->customplot->yAxis->setLabelColor(QColor(255,255,255));
设置坐标轴可拖动
//坐标轴拖动设置
    ui->customplot->setInteractions(QCP::iRangeDrag | QCP::iRangeZoom | QCP::iSelectLegend | QCP::iSelectPlottables);//允许可缩放,移动
    ui->customplot->axisRect()->setRangeDrag(Qt::Horizontal | Qt::Vertical);//设置曲线水平和垂直方向拖动
设置曲线
ui->customplot->addGraph();         // 增加图层
ui->customplot->graph(0)->setPen(QPen(Qt::red,1));    //颜色及线宽
设置图例
//显示图例
    ui->customplot->legend->setVisible(true);
    ui->customplot->legend->setBrush(QColor(255,255,255,0));//设置透明背景
    ui->customplot->legend->setTextColor(QColor(255,255,255));//设置字体颜色
    ui->customplot->legend->setBorderPen(QColor(255,255,255));//设置边框颜色
    ui->customplot->legend->setSelectableParts(QCPLegend::spItems);//设置图例的可选项为图例项
    ui->customplot->legend->setSelectedTextColor(QColor(255,255,255));//设置图例选中后字体
添加数据
ui->customplot->graph(0)->addData(x, y);


 3459
3459


 被折叠的 条评论
为什么被折叠?
被折叠的 条评论
为什么被折叠?
 到【灌水乐园】发言


