


一、QCustomPlot的安装与配置
1、下载安装
QCustomPlot官网链接:Qt Plotting Widget QCustomPlot - Introduction

2、添加qcustomplot.h与qcustomplot.cpp
将下载文件的qcustomplot.h与qcustomplot.cpp复制到自己的项目文件中,复制完后点击“添加现有文件”,可以在工程中显示 

3、添加QCustomPlot的帮助文档到QtCreator(可加可不加)
在QtCreator中,选择:工具 -> 选项 -> 帮助 -> 文档,你会看到一个加载文档模块的列表,以及添加/删除模块的按钮。点击"添加…"按钮,选择qcustomplot.qch文件。
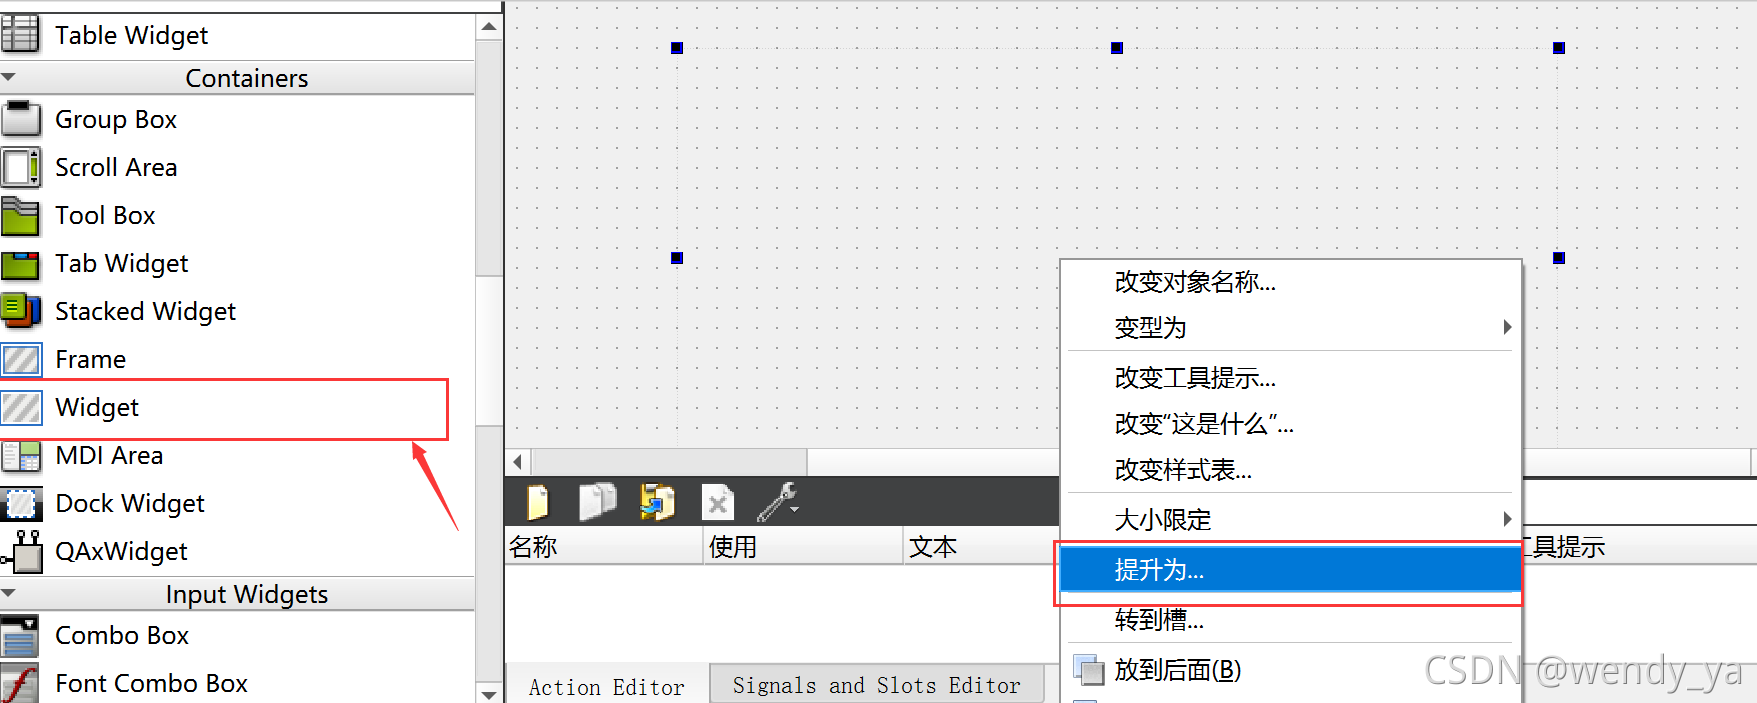
4、静态生成(控件提升)
在UI Designer中,可以拖动一个Widget(Graphics)控件到ui设计器上,对这个窗体点击右键,选择提升QCustomPlot


5、运行后有坐标生成成功!!!
二、常用类及其方法
1、QCustomPlot类:
这是主要的绘图窗口类,用于创建和管理绘图窗口。它是 QWidget 的子类,可以在 GUI 应用程序中使用。
常用方法:
addGraph():添加一个图形对象。graph(int index):获取指定索引处的图形对象。xAxis和yAxis:获取 x 轴和 y 轴对象。legend:获取图例对象。replot():重绘图表。
2、QCPGraph类:
这个类表示一个图形对象,可以用于绘制线条、散点图等。
常用方法:
setData(const QVector<double> &x, const QVector<double> &y):设置图形的数据点。setPen(const QPen &pen):设置图形的画笔样式。setScatterStyle(const QCPScatterStyle &style):设置图形的散点样式。
3、QCPAxis类:
这个类表示一个坐标轴对象,用于控制坐标轴的显示和属性。
常用方法:
setLabel(const QString &label):设置坐标轴的标签。setRange(double lower, double upper):设置坐标轴的范围。setTickLabels(bool visible):设置是否显示刻度标签。
4、QCPLegend类:
这个类表示一个图例对象,用于显示图表中各个图形的说明。
常用方法:
setVisible(bool visible):设置图例的可见性。setFont(const QFont &font):设置图例的字体。
5、QCPScatterStyle类:
这个类表示散点样式,可以用于自定义图形中散点的样式。
常用方法:
setShape(QCPScatterStyle::ScatterShape shape):设置散点的形状。setSize(double size):设置散点的大小。
三、动态散点图
效果图:

代码:
/*************************************初始化坐标轴配置***********************************/
Widget::Widget(QWidget *parent)
    : QWidget(parent)
    , ui(new Ui::Widget)
{
    ui->setupUi(this);

    // 为坐标轴添加标签
    ui->customPlot->xAxis->setLabel("x");
    ui->customPlot->yAxis->setLabel("y");
    ui->customPlot->xAxis2->setVisible(true);//设置顶部轴线可见
    ui->customPlot->yAxis2->setVisible(true);//设置右部轴线可见
    //当修改左和底坐标轴时,使之与右和上坐标轴也跟着变化()
    connect(ui->customPlot->xAxis, SIGNAL(rangeChanged(QCPRange)), ui->customPlot->xAxis2, SLOT(setRange(QCPRange)));
    connect(ui->customPlot->yAxis, SIGNAL(rangeChanged(QCPRange)), ui->customPlot->yAxis2, SLOT(setRange(QCPRange)));
    ui->customPlot->setInteractions(QCP::iRangeDrag | QCP::iRangeZoom | QCP::iSelectPlottables);//设置拖动、缩放、选择
}

/*************************************散点槽函数*****************************************/
void Widget::on_scatterDiagramBtn_clicked()
{
    if(timer->isActive()){//判断上一次定时器是否存在
        //释放定时器对象
        delete timer;
    }
    timer = new QTimer;

    //设置xy轴范围
    ui->customPlot->xAxis->setRange(-1.5,1.5);
    ui->customPlot->yAxis->setRange(-1.5,1.5);

    //动态显示
    connect(timer,&QTimer::timeout,this,[=]{
        //清除之前绘制的图像
        ui->customPlot->clearGraphs();
        //创建图像(默认曲线)
        ui->customPlot->addGraph();
        //图像设置
        ui->customPlot->graph(0)->setScatterStyle(QCPScatterStyle(QCPScatterStyle::ssDisc));//设置散点形状
        ui->customPlot->graph(0)->setLineStyle(QCPGraph::lsNone);//去除点之间的连线
        //添加数据
        double a,b,r;
        QVector<double> x,y;
        for(int i = 0;i<4048;i++){
            do{
                a = QRandomGenerator::global()->generateDouble() * 2 - 1;
                b = QRandomGenerator::global()->generateDouble() * 2 - 1;
                r = sqrt(pow(a,2) + pow(b,2));
            }while(r > 1);
            x.append(a);
            y.append(b);
        }
        ui->customPlot->graph(0)->addData(x,y);
        //重绘
        ui->customPlot->replot();
    });

    timer->start(0);
}
四、动态曲线图
效果图:

代码:
void Widget::on_lineChartBtn_clicked()
{
    i = 0,j = 0;//写成static double i,j后会造成每次进入该槽函数,起始位置是上一次的点位
    if(timer->isActive()){
        //释放定时器对象
        delete timer;
    }
    timer = new QTimer; // 将指针重新设置新对象
    //设置xy轴范围
    ui->customPlot->xAxis->setRange(0,10);
    ui->customPlot->yAxis->setRange(-2,2);
    //清除上一次图像
    ui->customPlot->clearGraphs();
    //创建图像
    ui->customPlot->addGraph();
    connect(timer,&QTimer::timeout,this,[=]{
        if(i >= 10){
            ui->customPlot->xAxis->setRange(i,10,Qt::AlignRight);//横坐标动起来的关键
        }
        //加数据
        j = qSin(i);
        ui->customPlot->graph(0)->addData(i,j);
        //重绘
        ui->customPlot->replot();
        i+=0.1;
    });

     timer->start(100);
}
五、QCustomPlot单游标在多个坐标系中切换
效果图:

代码:
    ui->customPlot3->legend->setVisible(true);

    //创建条形图对象:
    CustomBars *newFossil = new CustomBars(ui->customPlot3->xAxis, ui->customPlot3->yAxis);
    newFossil->setAntialiased(false);
    //设置名称和颜色:
    newFossil->setName("网络节点等级");
    newFossil->setPen(QPen(QColor(111, 9, 176).lighter(170)));
    newFossil->setBrush(QColor(111, 9, 176));

    //准备标签:
    QVector<double> newTicks;
    QVector<QString> newLabels;
    for(int i=1;i<=64;i++){
        newTicks.append(i);
        newLabels.append(QString("ID:%1").arg(i));
    }
    QSharedPointer<QCPAxisTickerText> newTextTicker(new QCPAxisTickerText);
    newTextTicker->addTicks(newTicks, newLabels);


    //加入数据:
    QVector<double> newFossilData;
    for (int i = 0; i < 64; ++i) {
        newFossilData.append(5 );
    }
    newFossil->setData(newTicks, newFossilData);

//    //创建条形图对象:
//    CustomBars *newNuclear = new CustomBars(volumeAxisRect->axis(QCPAxis::atBottom), volumeAxisRect->axis(QCPAxis::atLeft));
//    newNuclear->setAntialiased(false);

//    //设置名称和颜色:
//    newNuclear->setName("信号状态");
//    newNuclear->setPen(QPen(QColor(250, 170, 20).lighter(150)));
//    newNuclear->setBrush(QColor(250, 170, 20));

    //创建底部轴矩形的条形图:
    QCPAxisRect *volumeAxisRect = new QCPAxisRect(ui->customPlot3);
    ui->customPlot3->plotLayout()->addElement(1, 0, volumeAxisRect);
    volumeAxisRect->setMaximumSize(QSize(QWIDGETSIZE_MAX, 100));
    volumeAxisRect->axis(QCPAxis::atBottom)->setLayer("axes");
    volumeAxisRect->axis(QCPAxis::atBottom)->grid()->setLayer("grid");
    //使底部和主轴更近:
    ui->customPlot3->plotLayout()->setRowSpacing(0);
    volumeAxisRect->setAutoMargins(QCP::msLeft|QCP::msRight|QCP::msBottom);
    volumeAxisRect->setMargins(QMargins(0, 0, 0, 0));
    //创建两个条形图,正(绿),负(红):
    CustomBars *newRegen = new CustomBars(volumeAxisRect->axis(QCPAxis::atBottom), volumeAxisRect->axis(QCPAxis::atLeft));
    newRegen->setAntialiased(false);
    //设置名称和颜色:
    newRegen->setName("信号能量");
    newRegen->setPen(QPen(QColor(0, 168, 140).lighter(130)));
    newRegen->setBrush(QColor(0, 168, 140));
    ui->customPlot3->setAutoAddPlottableToLegend(false);

    //加入数据:
    QVector<double> newRegenData;
    for (int i = 0; i < 64; ++i) {
        newRegenData.append(10);
    }
    newRegen->setData(newTicks, newRegenData);

    //连接主轴和下轴x范围:
    connect(ui->customPlot3->xAxis, SIGNAL(rangeChanged(QCPRange)), volumeAxisRect->axis(QCPAxis::atBottom), SLOT(setRange(QCPRange)));
    connect(volumeAxisRect->axis(QCPAxis::atBottom), SIGNAL(rangeChanged(QCPRange)), ui->customPlot3->xAxis, SLOT(setRange(QCPRange)));
    //配置主轴和下轴矩形的轴:

    volumeAxisRect->axis(QCPAxis::atBottom)->setTicker(newTextTicker);
    volumeAxisRect->axis(QCPAxis::atBottom)->setTickLabelRotation(15);
    ui->customPlot3->xAxis->setBasePen(Qt::NoPen);
    ui->customPlot3->xAxis->setTickLabels(false);
    ui->customPlot3->xAxis->setTicks(false); // only want vertical grid in main axis rect, so hide xAxis backbone, ticks, and labels
    ui->customPlot3->xAxis->setTicker(newTextTicker);
    ui->customPlot3->rescaleAxes();
    ui->customPlot3->xAxis->scaleRange(1.025, ui->customPlot3->xAxis->range().center());
    ui->customPlot3->yAxis->scaleRange(1.1, ui->customPlot3->yAxis->range().center());

    //使轴矩形左侧对齐:
    QCPMarginGroup *newGroup = new QCPMarginGroup(ui->customPlot3);
    ui->customPlot3->axisRect()->setMarginGroup(QCP::msLeft|QCP::msRight, newGroup);
    volumeAxisRect->setMarginGroup(QCP::msLeft|QCP::msRight, newGroup);
    ui->customPlot3->setInteractions(QCP::iRangeDrag | QCP::iRangeZoom | QCP::iSelectPlottables);//设置拖动、缩放、选择
六、柱状图上显示数值

.h文件
#ifndef CUSTOMBARS_H
#define CUSTOMBARS_H

#include <QObject>
#include <qcustomplot.h>

// 头文件CustomBars.h
class CustomBars : public QCPBars
{
public:
    explicit CustomBars(QCPAxis *keyAxis, QCPAxis *valueAxis);

    Qt::Alignment textAligment() const { return mTextAlignment; }
    double spacing() const { return mSpacing; }
    QFont font() const { return mFont; }

    void setTextAlignment(Qt::Alignment alignment);
    void setSpacing(double spacing);
    void setFont(const QFont &font);

protected:
    Qt::Alignment mTextAlignment;   // 文字对齐方式
    double mSpacing;                // 文字与柱状图的间距,这里按像素大小
    QFont mFont;                    // 文字使用的字体

    virtual void draw(QCPPainter *painter) Q_DECL_OVERRIDE;
};

#endif // CUSTOMBARS_H
.cpp文件
// 源文件CustomBars.cpp
#include "custombars.h"
CustomBars::CustomBars(QCPAxis *keyAxis, QCPAxis *valueAxis)
    : QCPBars(keyAxis, valueAxis),
      mTextAlignment(Qt::AlignCenter),
      mSpacing(5),
      mFont(QFont(QLatin1String("sans serif"), 12))
{

}

void CustomBars::setTextAlignment(Qt::Alignment alignment)
{
    mTextAlignment = alignment;
}

void CustomBars::setSpacing(double spacing)
{
    mSpacing = spacing;
}

void CustomBars::setFont(const QFont &font)
{
    mFont = font;
}
void CustomBars::draw(QCPPainter *painter)
{
    if (!mKeyAxis || !mValueAxis) { qDebug() << Q_FUNC_INFO << "invalid key or value axis"; return; }
    if (mDataContainer->isEmpty()) return;

    QCPBarsDataContainer::const_iterator visibleBegin, visibleEnd;
    getVisibleDataBounds(visibleBegin, visibleEnd);

    // loop over and draw segments of unselected/selected data:
    QList<QCPDataRange> selectedSegments, unselectedSegments, allSegments;
    getDataSegments(selectedSegments, unselectedSegments);
    allSegments << unselectedSegments << selectedSegments;
    for (int i = 0; i < allSegments.size(); ++i)
    {
        bool isSelectedSegment = i >= unselectedSegments.size();
        QCPBarsDataContainer::const_iterator begin = visibleBegin;
        QCPBarsDataContainer::const_iterator end = visibleEnd;
        mDataContainer->limitIteratorsToDataRange(begin, end, allSegments.at(i));
        if (begin == end)
            continue;

        for (QCPBarsDataContainer::const_iterator it = begin; it != end; ++it)
        {
            // draw bar:
            if (isSelectedSegment && mSelectionDecorator)
            {
                mSelectionDecorator->applyBrush(painter);
                mSelectionDecorator->applyPen(painter);
            }
            else
            {
                painter->setBrush(mBrush);
                painter->setPen(mPen);
            }
            applyDefaultAntialiasingHint(painter);
            QRectF barRect = getBarRect(it->key, it->value);   //自己加的
            painter->drawPolygon(barRect);
            // 以上是拷贝的源码部分
            painter->drawPolygon(barRect);

            // 我们仅需在 painter->drawPolygon(barRect); 这行下增加以下的内容即可

            // 计算文字的位置
            painter->setFont(mFont);                     // 设置字体
            QString text  = QString::number(it->value, 'g', 2);   // 取得当前value轴的值,保留两位精度

            QRectF textRect = painter->fontMetrics().boundingRect(0, 0, 0, 0, Qt::TextDontClip | mTextAlignment, text);  // 计算文字所占用的大小

            if (mKeyAxis.data()->orientation() == Qt::Horizontal) {    // 当key轴为水平轴的时候
                if (mKeyAxis.data()->axisType() == QCPAxis::atTop)     // 上轴,移动文字到柱状图下面
                    textRect.moveTopLeft(barRect.bottomLeft() + QPointF(0, mSpacing));
                else                                                   // 下轴,移动文字到柱状图上面
                    textRect.moveBottomLeft(barRect.topLeft() - QPointF(0, mSpacing));
                textRect.setWidth(barRect.width());
                painter->drawText(textRect, Qt::TextDontClip | mTextAlignment, text);
            }
            else {                                                  // 当key轴为竖直轴的时候
                if (mKeyAxis.data()->axisType() == QCPAxis::atLeft)   // 左轴,移动文字到柱状图右边
                    textRect.moveTopLeft(barRect.topRight() + QPointF(mSpacing, 0));
                else                                                  // 右轴,移动文字到柱状图左边
                    textRect.moveTopRight(barRect.topLeft() - QPointF(mSpacing, 0));
                textRect.setHeight(barRect.height());
                painter->drawText(textRect, Qt::TextDontClip | mTextAlignment, text);
            }

        }
    }

}


 4912
4912


 被折叠的 条评论
为什么被折叠?
被折叠的 条评论
为什么被折叠?
 到【灌水乐园】发言


