


 本文详细介绍了Bokeh库中的布局方法,包括row、column、gridplot等,用于在同一图像中展示多个图表。同时,深入讲解了如何使用辅助标注、注释、矢量箭头等增强图表的可读性和表达力。
如果希望在同一张图上显示多个图像,可以使用bokeh.layouts类中的方法:
row()
column()
gridplot()
widgetbox()
layout()
row()
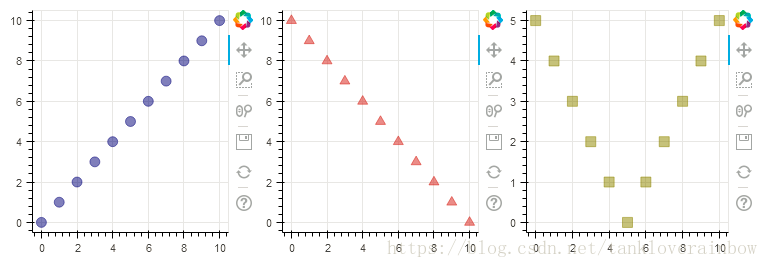
row()的作用是将多个图像以行的方式放到同一张图中。
from bokeh.io import output_file, show
from bokeh.layouts import row
from bokeh.plotting import figure

output_file("layout.html")

x = list(range(11))
y0 = x
y1 = [10 - i for i in x]
y2 = [abs(i - 5) for i in x]

# create a new plot
s1 = figure(plot_width=250, plot_height=250, title=None)
s1.circle(x, y0, size=10, color="navy", alpha=0.5)

# create another one
s2 = figure(plot_width=250, plot_height=250, title=None)
s2.triangle(x, y1, size=10, color="firebrick", alpha=0.5)

# create and another
s3 = figure(plot_width=250, plot_height=250, title=None)
s3.square(x, y2, size=10, color="olive", alpha=0.5)

# put the results in a row
show(row(s1, s2, s3))
column()
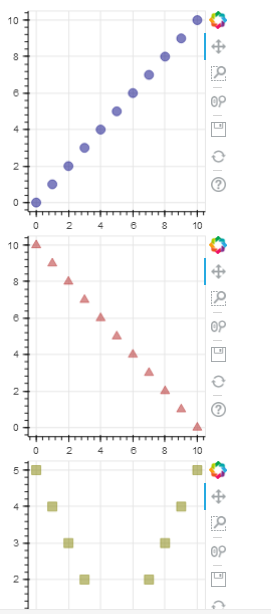
column()的作用是将多个图像以列的方式放到同一张图像中。
from bokeh.io import output_file, show
from bokeh.layouts import column
from bokeh.plotting import figure

output_file("layout.html")

x = list(range(11))
y0 = x
y1 = [10 - i for i in x]
y2 = [abs(i - 5) for i in x]

# create a new plot
s1 = figure(plot_width=250, plot_height=250, title=None)
s1.circle(x, y0, size=10, color="navy", alpha=0.5)

# create another one
s2 = figure(plot_width=250, plot_height=250, title=None)
s2.triangle(x, y1, size=10, color="firebrick", alpha=0.5)

# create and another
s3 = figure(plot_width=250, plot_height=250, title=None)
s3.square(x, y2, size=10, color="olive", alpha=0.5)

# put the results in a column and show
show(column(s1, s2, s3))
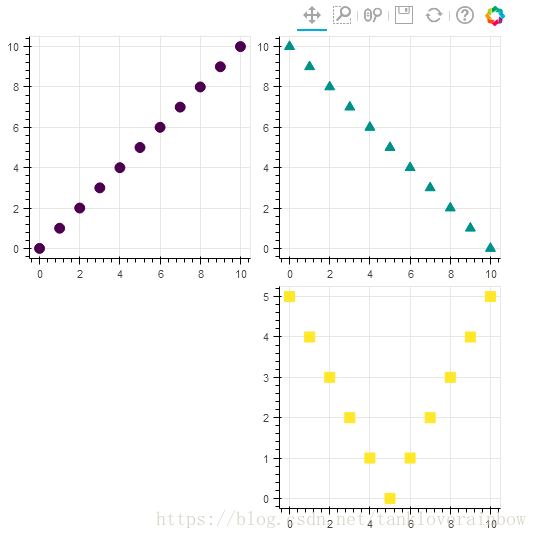
gridplot()
如果希望以矩阵的方式将多个图像放到同一张图上,可以使用gridplot()函数,如果某个位置的图像为空,可以设定为None。
from bokeh.io import output_file, show
from bokeh.layouts import gridplot
from bokeh.palettes import Viridis3
from bokeh.plotting import figure

output_file("layout_grid.html")

x = list(range(11))
y0 = x
y1 = [10 - i for i in x]
y2 = [abs(i - 5) for i in x]

# create three plots
p1 = figure(plot_width=250, plot_height=250, title=None)
p1.circle(x, y0, size=10, color=Viridis3[0])
p2 = figure(plot_width=250, plot_height=250, title=None)
p2.triangle(x, y1, size=10, color=Viridis3[1])
p3 = figure(plot_width=250, plot_height=250, title=None)
p3.square(x, y2, size=10, color=Viridis3[2])

# make a grid
grid = gridplot([[p1, p2], [None, p3]])

# show the results
show(grid)
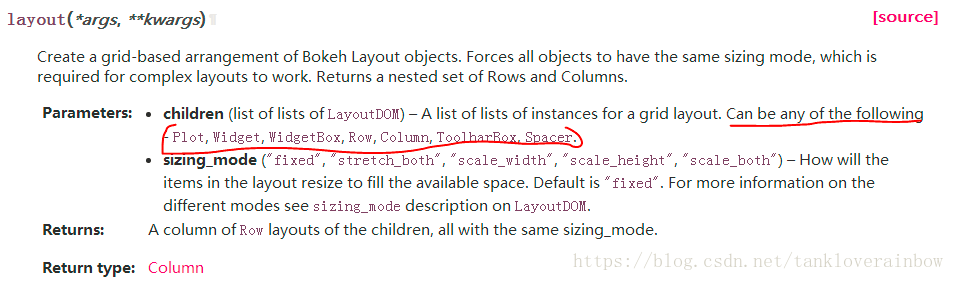
要注意的是,gridplot()函数只能接受figure类,不能接受widget类,如果希望一张图像中既有figure类也有widget类,就需要用layout()方法。文档中关于gridplot()的介绍如下,可以看到输入参数只能是Plot类,即figure类:

widgetbox()
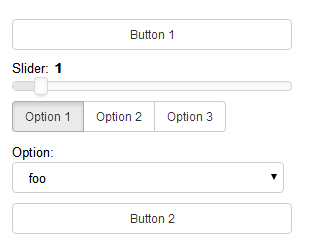
如果希望在图像中插入widgets(小部件),可以使用widgetbox()函数。
from bokeh.io import output_file, show
from bokeh.layouts import widgetbox
from bokeh.models.widgets import Button, RadioButtonGroup, Select, Slider

output_file("layout_widgets.html")

# create some widgets
slider = Slider(start=0, end=10, value=1, step=.1, title="Slider")
button_group = RadioButtonGroup(labels=["Option 1", "Option 2", "Option 3"], active=0)
select = Select(title="Option:", value="foo", options=["foo", "bar", "baz", "quux"])
button_1 = Button(label="Button 1")
button_2 = Button(label="Button 2")

# put the results in a row
show(widgetbox(button_1, slider, button_group, select, button_2, width=300))
layout()
layout()函数的作用有两个:
- 将多个图像按照矩阵样式摆放到同一张图中
- 输入参数可以是Plot, Widget, WidgetBox, Row, Column, ToolbarBox, Spacer,不仅限于Plot类
官网文档中的介绍如下:
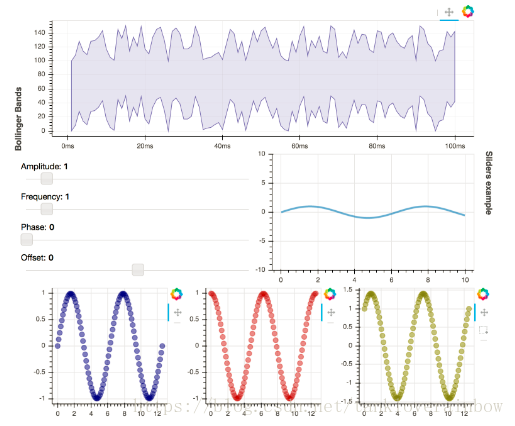
来自github中的一个例子如下:
import numpy as np

from bokeh.layouts import layout
from bokeh.models import CustomJS, Slider, ColumnDataSource, WidgetBox
from bokeh.plotting import figure, output_file, show

output_file('dashboard.html')

tools = 'pan'


def bollinger():
    # Define Bollinger Bands.
    upperband = np.random.random_integers(100, 150, size=100)
    lowerband = upperband - 100
    x_data = np.arange(1, 101)

    # Bollinger shading glyph:
    band_x = np.append(x_data, x_data[::-1])
    band_y = np.append(lowerband, upperband[::-1])

    p = figure(x_axis_type='datetime', tools=tools)
    p.patch(band_x, band_y, color='#7570B3', fill_alpha=0.2)

    p.title.text = 'Bollinger Bands'
    p.title_location = 'left'
    p.title.align = 'left'
    p.plot_height = 600
    p.plot_width = 800
    p.grid.grid_line_alpha = 0.4
    return [p]


def slider():
    x = np.linspace(0, 10, 100)
    y = np.sin(x)

    source = ColumnDataSource(data=dict(x=x, y=y))

    plot = figure(
        y_range=(-10, 10), tools='', toolbar_location=None,
        title="Sliders example")
    plot.line('x', 'y', source=source, line_width=3, line_alpha=0.6)

    callback = CustomJS(args=dict(source=source), code="""
        var data = source.data;
        var A = amp.value;
        var k = freq.value;
        var phi = phase.value;
        var B = offset.value;
        var x = data['x']
        var y = data['y']
        for (var i = 0; i < x.length; i++) {
            y[i] = B + A*Math.sin(k*x[i]+phi);
        }
        source.change.emit();
    """)

    amp_slider = Slider(start=0.1, end=10, value=1, step=.1, title="Amplitude", callback=callback, callback_policy='mouseup')
    callback.args["amp"] = amp_slider

    freq_slider = Slider(start=0.1, end=10, value=1, step=.1, title="Frequency", callback=callback)
    callback.args["freq"] = freq_slider

    phase_slider = Slider(start=0, end=6.4, value=0, step=.1, title="Phase", callback=callback)
    callback.args["phase"] = phase_slider

    offset_slider = Slider(start=-5, end=5, value=0, step=.1, title="Offset", callback=callback)
    callback.args["offset"] = offset_slider

    widgets = WidgetBox(amp_slider, freq_slider, phase_slider, offset_slider)
    return [widgets, plot]


def linked_panning():
    N = 100
    x = np.linspace(0, 4 * np.pi, N)
    y1 = np.sin(x)
    y2 = np.cos(x)
    y3 = np.sin(x) + np.cos(x)

    s1 = figure(tools=tools)
    s1.circle(x, y1, color="navy", size=8, alpha=0.5)
    s2 = figure(tools=tools, x_range=s1.x_range, y_range=s1.y_range)
    s2.circle(x, y2, color="firebrick", size=8, alpha=0.5)
    s3 = figure(tools='pan, box_select', x_range=s1.x_range)
    s3.circle(x, y3, color="olive", size=8, alpha=0.5)
    return [s1, s2, s3]

l = layout([
    bollinger(),
    slider(),
    linked_panning(),
], sizing_mode='stretch_both')

show(l)
辅助标注、注释、矢量箭头
参考官方文档:https://bokeh.pydata.org/en/latest/docs/user_guide/annotations.html#color-bars
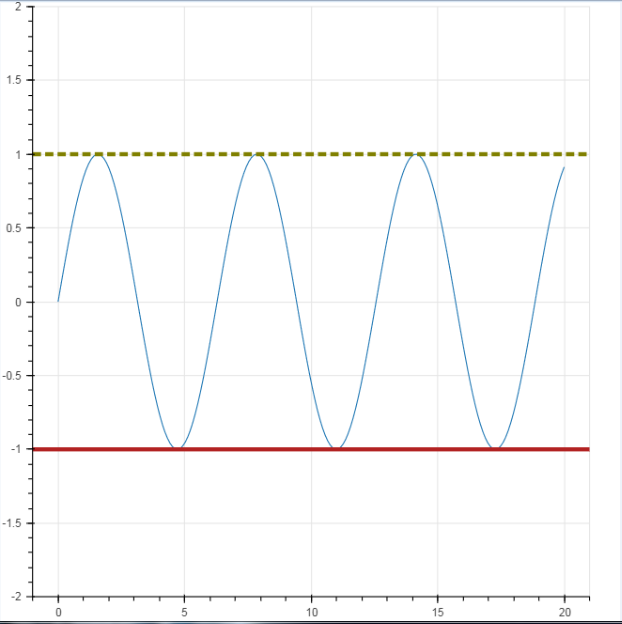
1. 辅助标注 - 线
import numpy as np
import pandas as pd
import matplotlib.pyplot as plt
% matplotlib inline

import warnings
warnings.filterwarnings('ignore')
# 不发出警告

from bokeh.io import output_notebook
output_notebook()
# 导入notebook绘图模块

from bokeh.plotting import figure,show
# 导入图表绘制、图标展示模块
# 辅助标注 - 线

from bokeh.models.annotations import Span
# 导入Span模块

x = np.linspace(0, 20, 200)
y = np.sin(x)
# 创建x,y数据
p = figure(y_range=(-2, 2))
p.line(x, y)
# 绘制曲线
upper = Span(location=1,           # 设置位置,对应坐标值
             dimension='width',    # 设置方向,width为横向,height为纵向
             line_color='olive', line_width=4,   # 设置线颜色、线宽
             line_dash = [8,4]
            )
p.add_layout(upper)
# 绘制辅助线1
lower = Span(location=-1, dimension='width', line_color='firebrick', line_width=4)
p.add_layout(lower)
# 绘制辅助线2
show(p)
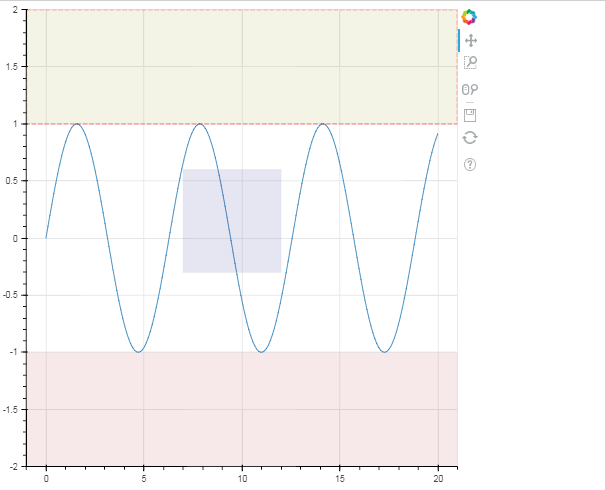
2. 辅助标注 - 矩形
# 辅助标注 - 矩形

from bokeh.models.annotations import BoxAnnotation
# 导入BoxAnnotation模块

x = np.linspace(0, 20, 200)
y = np.sin(x)
# 创建x,y数据

p = figure(y_range=(-2, 2))
p.line(x, y)
# 绘制曲线

upper = BoxAnnotation(bottom=1, fill_alpha=0.1, fill_color='olive', line_width = 2, line_dash = [6,2], line_color = 'red')
p.add_layout(upper)
# 绘制辅助矩形1

lower = BoxAnnotation(top=-1, fill_alpha=0.1, fill_color='firebrick')
p.add_layout(lower)
# 绘制辅助矩形2

center = BoxAnnotation(top=0.6, bottom=-0.3, left=7, right=12,  # 设置矩形四边位置
                       fill_alpha=0.1, fill_color='navy'        # 设置透明度、颜色
                      )
p.add_layout(center)
# 绘制辅助矩形3

show(p)
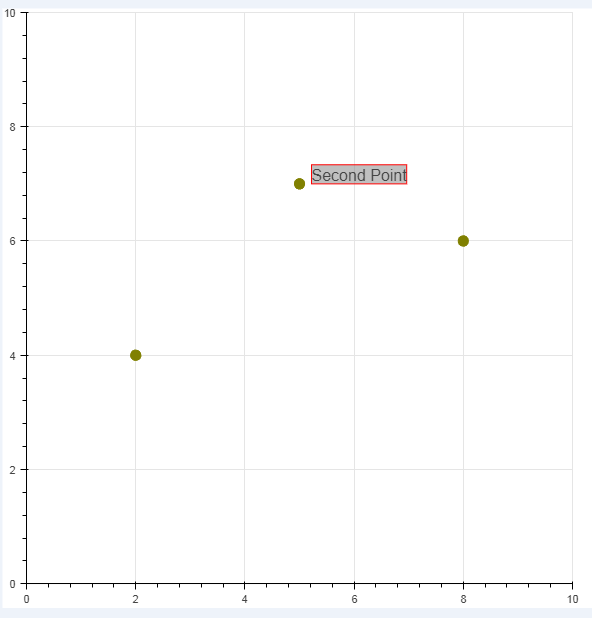
3. 绘图注释
# 绘图注释

from bokeh.models.annotations import Label# Label是标注的注释
# 导入Label模块,注意是annotations中的Label

p = figure(x_range=(0,10), y_range=(0,10))
p.circle([2, 5, 8], [4, 7, 6], color="olive", size=10)
# 绘制散点图

label = Label(x=5, y=7,       # 标注注释位置
              x_offset=12,    # x偏移,同理y_offset
              text="Second Point",      # 注释内容
              text_font_size="12pt",    # 字体大小
              border_line_color="red", background_fill_color="gray", background_fill_alpha = 0.5   # 背景线条颜色、背景颜色、透明度
             )
p.add_layout(label)
# 绘制注释

show(p)
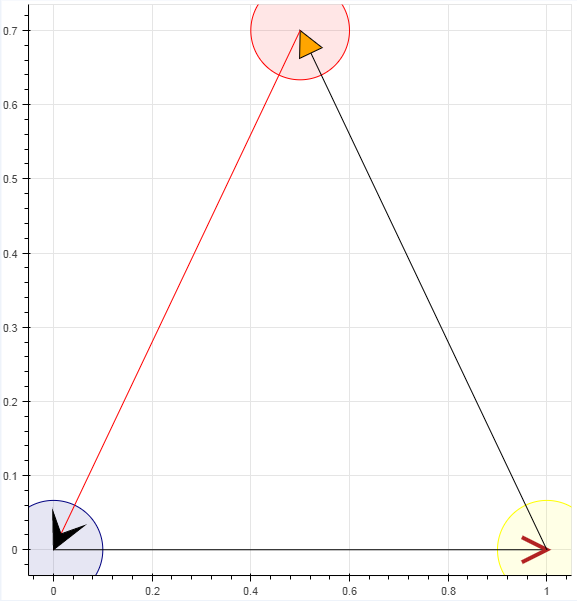
4. 注释箭头
# 注释箭头

from bokeh.models.annotations import Arrow
from bokeh.models.arrow_heads import OpenHead, NormalHead, VeeHead   # 三种箭头类型
# 导入相关模块

p = figure(plot_width=600, plot_height=600)
p.circle(x=[0, 1, 0.5], y=[0, 0, 0.7], radius=0.1, color=["navy", "yellow", "red"], fill_alpha=0.1)
# 创建散点图

p.add_layout(Arrow(end=OpenHead(line_color="firebrick", line_width=4),  # 设置箭头类型,及相关参数:OpenHead, NormalHead, VeeHead
                   x_start=0, y_start=0, x_end=1, y_end=0))   # 设置箭头矢量方向
# 绘制箭头1

p.add_layout(Arrow(end=NormalHead(fill_color="orange"),
                   x_start=1, y_start=0, x_end=0.5, y_end=0.7))
# 绘制箭头2

p.add_layout(Arrow(end=VeeHead(size=35), line_color="red",
                   x_start=0.5, y_start=0.7, x_end=0, y_end=0))
# 绘制箭头3

show(p)
5. 调色盘
# 调色盘
# 颜色参考文档:http://bokeh.pydata.org/en/latest/docs/reference/palettes.html
# ColorBrewer:http://colorbrewer2.org/#type=sequential&scheme=BuGn&n=3

import bokeh.palettes as bp
from bokeh.palettes import brewer

print('所有调色板名称:\n',bp.__palettes__)
print('-------')
# 查看所有调色板名称

print('蓝色调色盘颜色:\n',bp.Blues)
print('-------')
# 查看蓝色调色盘颜色

n = 8
colori = brewer['YlGn'][n]
print('YlGn调色盘解析为%i个颜色,分别为:\n' % n, colori)
# 调色盘解析 → 不同颜色解析最多颜色有限
所有调色板名称:
 ['Accent3', 'Accent4', 'Accent5', 'Accent6', 'Accent7', 'Accent8', 'Blues3', 'Blues4', 'Blues5', 'Blues6', 'Blues7', 'Blues8', 'Blues9', 'BrBG3', 'BrBG4', 'BrBG5', 'BrBG6', 'BrBG7', 'BrBG8', 'BrBG9', 'BrBG10', 'BrBG11', 'BuGn3', 'BuGn4', 'BuGn5', 'BuGn6', 'BuGn7', 'BuGn8', 'BuGn9', 'BuPu3', 'BuPu4', 'BuPu5', 'BuPu6', 'BuPu7', 'BuPu8', 'BuPu9', 'Category10_3', 'Category10_4', 'Category10_5', 'Category10_6', 'Category10_7', 'Category10_8', 'Category10_9', 'Category10_10', 'Category20_3', 'Category20_4', 'Category20_5', 'Category20_6', 'Category20_7', 'Category20_8', 'Category20_9', 'Category20_10', 'Category20_11', 'Category20_12', 'Category20_13', 'Category20_14', 'Category20_15', 'Category20_16', 'Category20_17', 'Category20_18', 'Category20_19', 'Category20_20', 'Category20b3', 'Category20b4', 'Category20b5', 'Category20b6', 'Category20b7', 'Category20b8', 'Category20b9', 'Category20b10', 'Category20b11', 'Category20b12', 'Category20b13', 'Category20b14', 'Category20b15', 'Category20b16', 'Category20b17', 'Category20b18', 'Category20b19', 'Category20b20', 'Category20c3', 'Category20c4', 'Category20c5', 'Category20c6', 'Category20c7', 'Category20c8', 'Category20c9', 'Category20c10', 'Category20c11', 'Category20c12', 'Category20c13', 'Category20c14', 'Category20c15', 'Category20c16', 'Category20c17', 'Category20c18', 'Category20c19', 'Category20c20', 'Colorblind3', 'Colorblind4', 'Colorblind5', 'Colorblind6', 'Colorblind7', 'Colorblind8', 'Dark2_3', 'Dark2_4', 'Dark2_5', 'Dark2_6', 'Dark2_7', 'Dark2_8', 'GnBu3', 'GnBu4', 'GnBu5', 'GnBu6', 'GnBu7', 'GnBu8', 'GnBu9', 'Greens3', 'Greens4', 'Greens5', 'Greens6', 'Greens7', 'Greens8', 'Greens9', 'Greys3', 'Greys4', 'Greys5', 'Greys6', 'Greys7', 'Greys8', 'Greys9', 'Greys256', 'Inferno3', 'Inferno4', 'Inferno5', 'Inferno6', 'Inferno7', 'Inferno8', 'Inferno9', 'Inferno10', 'Inferno11', 'Inferno256', 'Magma3', 'Magma4', 'Magma5', 'Magma6', 'Magma7', 'Magma8', 'Magma9', 'Magma10', 'Magma11', 'Magma256', 'OrRd3', 'OrRd4', 'OrRd5', 'OrRd6', 'OrRd7', 'OrRd8', 'OrRd9', 'Oranges3', 'Oranges4', 'Oranges5', 'Oranges6', 'Oranges7', 'Oranges8', 'Oranges9', 'PRGn3', 'PRGn4', 'PRGn5', 'PRGn6', 'PRGn7', 'PRGn8', 'PRGn9', 'PRGn10', 'PRGn11', 'Paired3', 'Paired4', 'Paired5', 'Paired6', 'Paired7', 'Paired8', 'Paired9', 'Paired10', 'Paired11', 'Paired12', 'Pastel1_3', 'Pastel1_4', 'Pastel1_5', 'Pastel1_6', 'Pastel1_7', 'Pastel1_8', 'Pastel1_9', 'Pastel2_3', 'Pastel2_4', 'Pastel2_5', 'Pastel2_6', 'Pastel2_7', 'Pastel2_8', 'PiYG3', 'PiYG4', 'PiYG5', 'PiYG6', 'PiYG7', 'PiYG8', 'PiYG9', 'PiYG10', 'PiYG11', 'Plasma3', 'Plasma4', 'Plasma5', 'Plasma6', 'Plasma7', 'Plasma8', 'Plasma9', 'Plasma10', 'Plasma11', 'Plasma256', 'PuBu3', 'PuBu4', 'PuBu5', 'PuBu6', 'PuBu7', 'PuBu8', 'PuBu9', 'PuBuGn3', 'PuBuGn4', 'PuBuGn5', 'PuBuGn6', 'PuBuGn7', 'PuBuGn8', 'PuBuGn9', 'PuOr3', 'PuOr4', 'PuOr5', 'PuOr6', 'PuOr7', 'PuOr8', 'PuOr9', 'PuOr10', 'PuOr11', 'PuRd3', 'PuRd4', 'PuRd5', 'PuRd6', 'PuRd7', 'PuRd8', 'PuRd9', 'Purples3', 'Purples4', 'Purples5', 'Purples6', 'Purples7', 'Purples8', 'Purples9', 'RdBu3', 'RdBu4', 'RdBu5', 'RdBu6', 'RdBu7', 'RdBu8', 'RdBu9', 'RdBu10', 'RdBu11', 'RdGy3', 'RdGy4', 'RdGy5', 'RdGy6', 'RdGy7', 'RdGy8', 'RdGy9', 'RdGy10', 'RdGy11', 'RdPu3', 'RdPu4', 'RdPu5', 'RdPu6', 'RdPu7', 'RdPu8', 'RdPu9', 'RdYlBu3', 'RdYlBu4', 'RdYlBu5', 'RdYlBu6', 'RdYlBu7', 'RdYlBu8', 'RdYlBu9', 'RdYlBu10', 'RdYlBu11', 'RdYlGn3', 'RdYlGn4', 'RdYlGn5', 'RdYlGn6', 'RdYlGn7', 'RdYlGn8', 'RdYlGn9', 'RdYlGn10', 'RdYlGn11', 'Reds3', 'Reds4', 'Reds5', 'Reds6', 'Reds7', 'Reds8', 'Reds9', 'Set1_3', 'Set1_4', 'Set1_5', 'Set1_6', 'Set1_7', 'Set1_8', 'Set1_9', 'Set2_3', 'Set2_4', 'Set2_5', 'Set2_6', 'Set2_7', 'Set2_8', 'Set3_3', 'Set3_4', 'Set3_5', 'Set3_6', 'Set3_7', 'Set3_8', 'Set3_9', 'Set3_10', 'Set3_11', 'Set3_12', 'Spectral3', 'Spectral4', 'Spectral5', 'Spectral6', 'Spectral7', 'Spectral8', 'Spectral9', 'Spectral10', 'Spectral11', 'Viridis3', 'Viridis4', 'Viridis5', 'Viridis6', 'Viridis7', 'Viridis8', 'Viridis9', 'Viridis10', 'Viridis11', 'Viridis256', 'YlGn3', 'YlGn4', 'YlGn5', 'YlGn6', 'YlGn7', 'YlGn8', 'YlGn9', 'YlGnBu3', 'YlGnBu4', 'YlGnBu5', 'YlGnBu6', 'YlGnBu7', 'YlGnBu8', 'YlGnBu9', 'YlOrBr3', 'YlOrBr4', 'YlOrBr5', 'YlOrBr6', 'YlOrBr7', 'YlOrBr8', 'YlOrBr9', 'YlOrRd3', 'YlOrRd4', 'YlOrRd5', 'YlOrRd6', 'YlOrRd7', 'YlOrRd8', 'YlOrRd9']
-------
蓝色调色盘颜色:
 {3: ['#3182bd', '#9ecae1', '#deebf7'], 4: ['#2171b5', '#6baed6', '#bdd7e7', '#eff3ff'], 5: ['#08519c', '#3182bd', '#6baed6', '#bdd7e7', '#eff3ff'], 6: ['#08519c', '#3182bd', '#6baed6', '#9ecae1', '#c6dbef', '#eff3ff'], 7: ['#084594', '#2171b5', '#4292c6', '#6baed6', '#9ecae1', '#c6dbef', '#eff3ff'], 8: ['#084594', '#2171b5', '#4292c6', '#6baed6', '#9ecae1', '#c6dbef', '#deebf7', '#f7fbff'], 9: ['#08306b', '#08519c', '#2171b5', '#4292c6', '#6baed6', '#9ecae1', '#c6dbef', '#deebf7', '#f7fbff']}
-------
YlGn调色盘解析为8个颜色,分别为:
 ['#005a32', '#238443', '#41ab5d', '#78c679', '#addd8e', '#d9f0a3', '#f7fcb9', '#ffffe5']
来源:https://blog.csdn.net/tankloverainbow/article/details/80464759
http://www.cnblogs.com/shengyang17/p/9736753.html


 1万+
1万+

 被折叠的 条评论
为什么被折叠?
被折叠的 条评论
为什么被折叠?
 到【灌水乐园】发言


