


一、canvas元素的属性
| 属性 | 描述 | 默认值 |
| width | canvas元素绘图表面的宽度。在默认情况下,浏览器会将canvas元素的大小设定成与绘图表面大小一致。然而,如果在css中覆写了元素的大小,那么浏览器则会将绘图表面进行缩放,使之符合元素尺寸 | 300 |
| height | canvas元素绘图表面的高度。浏览器可能会将绘图表面缩放至与元素相同的尺寸。具体请参照对width的描述。 | 150 |
注:按照规范,不能给数值加px后缀。
二、canvas元素的方法
| 属性 | 描述 |
| getContext() | 返回与该canvas元素相关的绘图环境对象。每个canvas元素均有一个这样的环境对象,而且每个环境对象均与一个canvas元素相关联 |
| toDataURL(type,quality) | 返回一个数据地址(data URL),你可以将它设定为ing元素的src属性值。第一个参数制定了图像的类型,例如image/jpeg或者image/png,如果不指定,则默认使用image/png。第二个参数必须是0~01.0之间的double值,他表示JPEG图像的显示质量。注:quality越大,图片的质量越高。且只适用于image/jpeg类型的图片,image/png类型都是以高质量图片得形式展示。 |
| toBlob(callback,type,args……) | 创建一个用于表示canvas元素图像文件的Blob,第一个参数是一个回调函数,浏览器会以一个指向blob的引用为参数,去调用该回调函数。第二个参数以“image/png”这样的形式来制定图像类型。如果不指定,则默认使用“image/png”。最后一个参数是介于0.0~1.0之间的值,表示JPEG图片的质量。将来可可能会加入其它一些用于精确调控图像属性的参数。 |
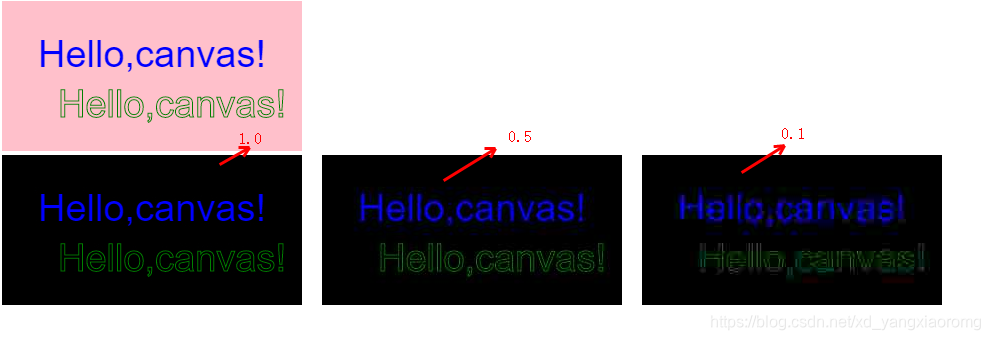
用一个例子对toDataURL做一个介绍:
<!DOCTYPE html>
<html>
<head>
<title>canvas</title>
<style type="text/css">
.imgContent{
height:auto;
}
.imgContent img{
width:300px;
height: 150px;
float:left;
margin-right:20px;
}
</style>
</head>
<body>
<canvas id="canvas" width="300" height="150" style="background-color:pink">
该浏览器不支持canvas!
</canvas>
<div class="imgContent">
<img src="" id="img1" />
<img src="" id="img2" />
<img src="" id="img3" />
</div>
<script type="text/javascript">
var myCanvas = document.getElementById('canvas');
var context = myCanvas.getContext('2d');
context.font="38px Arial";
context.fillStyle="blue";
context.strokeStyle="green";
context.textAlign = 'center';
context.textBaseline = 'bottom';
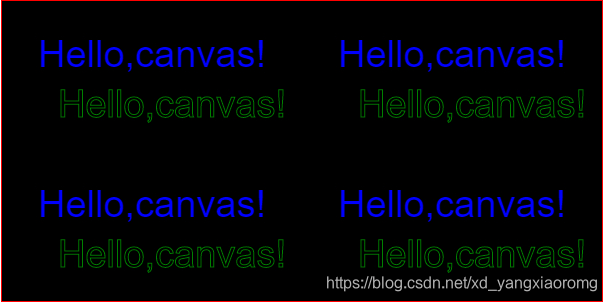
context.fillText('Hello,canvas!',myCanvas.width/2, myCanvas.height/2)
context.strokeText('Hello,canvas!',myCanvas.width/2+20, myCanvas.height/2+50)
var fullQuality = canvas.toDataURL("image/jpeg", 1.0);
var mediumQuality = canvas.toDataURL("image/jpeg", 0.5);
var lowQuality = canvas.toDataURL("image/jpeg", 0.1);
document.getElementById('img1').setAttribute("src",fullQuality);
document.getElementById('img2').setAttribute("src",mediumQuality);
document.getElementById('img3').setAttribute("src",lowQuality);
</script>
</body>
</html>得到的三张quality分别为1.0,0.5,0.1的jpeg图片,质量如下:
 三、canvas的绘图环境
1.2d绘图环境
以下是2d绘图环境的全部属性,后续章节会具体介绍。
| 属性 | 简介 |
| canvas | 指向该环境所属的canvas对象。该属性最常见的用途是通过它来获取canvas的高度和宽度,分别调用context.canvas.width和context.canvas.height即可 |
| fillStyle | 制定该绘图环境在后续的图像填充操作中所使用的颜色、渐变色或图案 |
| font | 设定在调用绘图环境对应的fillText()或strokeText()方法时,所使用的字型,eg:context.font = 'bold 35px Arial'; |
| globalAlpha | 全局透明度设定,它可以取0(完全透明)~1.0(完全不透明)之间的值,浏览器会将每个元素的alpha值与该值相乘,在绘制图像时也是如此 |
| globalCompsiteOperation | 该值决定了浏览器将某个物体绘制在其他物体之上时,所采用的绘制方式。后续详细介绍有效值。 |
| lineCap | 该值告诉浏览器如何绘制线的端点。可取值:butt、round、square。默认值是butt。 |
| lineWidth | 该值决定了再canvas之中绘制线段的屏幕像素宽度。它必须是个非负、非无穷的double值。默认值是1.0。 |
| lineJoin | 告诉浏览器在两条线段相交时如何绘制焦点。可取值:bevel、round、miter。默认值是miter。 |
| miterLimit | 告诉浏览器如何绘制miter形式的线段焦点。 |
| shadowBlur | 该值决定了浏览器如何延伸阴影效果。值越高,阴影效果延伸得就越远。盖值不是指阴影的像素长度,而是代表高斯模糊方程式中的参数值,他必须是一个非负且非无穷量的double值,默认值是0。 |
| shadowColor | 该值告诉浏览器使用何种颜色来绘制阴影。通常采用半透明色的色作为该属性的值,以便让后面的背景颜色能显示出来。 |
| shadowOffsetX | 以像素为单位,指定了阴影效果的水平方向偏移量 |
| shadowOffsetY | 以像素为单位,指定了阴影效果的垂直方向偏移量 |
| strokeStyle | 指定了对路径进行描边时所采用的绘制风格。该值可被设定为某个颜色、渐变色或图案。 |
| textAlign | 决定了fillText()或strokeText()方法进行绘制时,所画文本的水平对齐方式 |
| textBaseline | 决定了fillText()或strokeText()方法进行绘制时,所画文本的垂直对齐方式 |
2.3d绘图环境WebGL
非常酷炫的功能,这里暂且不做介绍。
四、Canvas状态的保存和恢复
绘图环境的save()方法会将当前的绘图环境压入堆栈顶部。对应的restore()方法则会从堆栈顶部弹出一组状态信息,并据此恢复当前绘图环境的各个状态。这意味着我们可以嵌套式的调用save()/restore()方法。
| 方法 | 描述 |
| save() | 将当前canvas的状态推送到一个保存canvas装套的堆栈顶部。canvas状态包括了当前的坐标变换信息、剪辑区域以及所有canvas绘制环境对象的属性,包括strokeStyle、fillStyle与globalCompsiteOperation等。 canvas状态并不包括当前的路径或位图。只能通过beginPath()来重置路径。至于位图,他是canvas本身的一个属性,并不属于绘图环境对象。 注:尽管位图是canvas对象本身的属性,然而也可以通过绘图环境对象来访问它(在环境对象上调用getImageData()方法) |
| restore() | 将canvas当前的状态堆栈顶部的条目弹出。原来保存于栈顶部的那一组状态,在弹出之后,就被设置成canvas当前的状态了。在调用save()和restore()方法之间,对canvas状态所进行的修稿,起效果只会持续至restore()方法被调用之前。 |
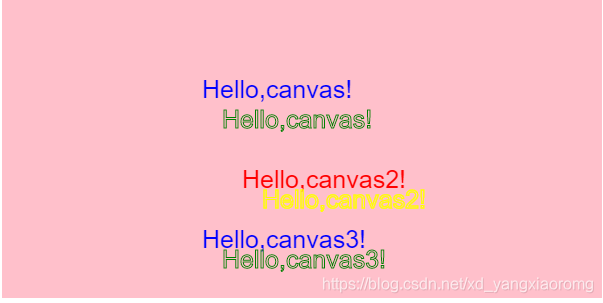
eg:
<!DOCTYPE html>
<html>
<head>
	<title>canvas</title>
</head>
<body>
	<canvas id="canvas" width="600" height="300" style="background-color:pink">
		该浏览器不支持canvas!
	</canvas>
	<script type="text/javascript">
		var myCanvas = document.getElementById('canvas');
		var context = myCanvas.getContext('2d');
		context.font="25px Arial";
		context.fillStyle="blue";
		context.strokeStyle="green";
		context.fillText('Hello,canvas!',myCanvas.width/3, myCanvas.height/3)
		context.strokeText('Hello,canvas!',myCanvas.width/3+20, myCanvas.height/3+30)
		context.save();//保存当前绘制参数,用于下一次绘制

		//选择新的颜色来绘制文字
		context.fillStyle="red";
		context.strokeStyle="yellow";
		context.fillText('Hello,canvas2!',myCanvas.width/3+40, myCanvas.height/3+90);
		context.strokeText('Hello,canvas2!',myCanvas.width/3+60, myCanvas.height/3+110)

		context.restore();//取出之前的状态,重新绘制文字,不需要再重新定义绘制颜色
		context.fillText('Hello,canvas3!',myCanvas.width/3, myCanvas.height/3+150);
		context.strokeText('Hello,canvas3!',myCanvas.width/3+20, myCanvas.height/3+170)

	</script>
</body>
</html>
效果图:
五、canvas画图实践、基本操作练习
1、canvas一些基本操作的简介:
画直线 :moveTo移动到某一点准备状态 ,lineTo线的下一个点坐标, stroke() 绘制信号
//绘制一条由坐标(50,50)至坐标(100,100),再到坐标(50,150)的宽度为10的红色线,这里绘制了两条直线,下一条的起点恰好是上一条的终点
ctx.moveTo(50,50);
ctx.lineTo(100,100);
ctx.lineTo(50,150);
ctx.lineWidth = "10";
ctx.strokeStyle = "red";
ctx.stroke(); 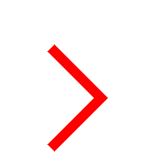
画折线:
beginPath()开始全新的绘制, closePath()绘制结束-闭合
填充与绘制的区别: fill(), stroke(), fillStyle ,strokeStyle
ctx.beginPath();
ctx.moveTo(100,50);
ctx.lineTo(150,100);
ctx.lineTo(100,150);
ctx.lineWidth = "2";//默认是1
ctx.strokeStyle="blue";
ctx.closePath();//将折线闭合
ctx.stroke();

ctx.beginPath();
ctx.moveTo(200,50);
ctx.lineTo(250,100);
ctx.lineTo(150,150);
ctx.lineWidth = "2";
ctx.fillStyle="red";
ctx.closePath();//将折线闭合
ctx.fill();
//stroke只画边,与strokeStyle配套使用,fill将整个图形填充,与fillStyle配套使用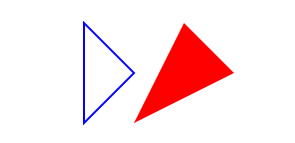
画矩形
1、设置填充样式或者边框样式(ctx.fillStyle = "color";或者ctx.strokeStyle = "color";) 2、绘制矩形区域(如果采用fillRect或者strokeRect绘制矩形,可以省略第3步);
3、填充或者加上边框(ctx.fill();或者ctx.stroke();)
ctx.rect(50,50,100,100);
ctx.fillStyle = "green";
ctx.strokeStyle = "red";
ctx.fill();
ctx.stroke();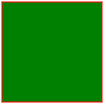
画圆弧
1、设置填充样式或者边框样式(ctx.fillStyle = "color";或者ctx.strokeStyle = "color";)
2、绘制圆形区域 ctx.arc(x,y,r,startAngle,endAngle,boolean); r代表半径,startAngle,endAngle分别代表开始角度和结束角度,最后一个参数表示true(逆时 针),false(顺时针)
3、填充或者加上边框(ctx.fill();或者ctx.stroke();)
注:1、在绘制圆弧的时候,必须使用ctx.beginPath()开始和ctx.closePath()结束,当然,前提 条件时你要画规则的图形。
//用两个嵌套的圆来绘制一个月亮
ctx.beginPath();
ctx.arc(200,200,80,0,Math.PI*2,false);
ctx.fillStyle="yellow";
ctx.fill();
ctx.closePath();
ctx.beginPath();
ctx.arc(160,200,70,0,Math.PI*2,false);
ctx.fillStyle="white";
ctx.fill();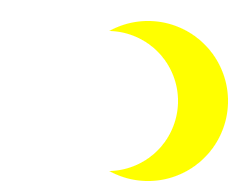
绘制文字:
ctx.fillStyle = "color";或者ctx.strokeStyle = "color";
ctx.textBaseline = "";设置垂直对齐方式 ctx.textAlign = "";
设置水平对齐方式 ctx.fillText("文本",x,y)(实心字)或者ctx.strokeText("文本",x,y)(字的轮廓);
textBaseLine 文本基线:可取值为alphabetic, top, hanging, middle ,ideographic, bottom。
textAlign为当前对齐方式:可取取为 start ,end, center ,left ,right。
绘制贝塞尔曲线:
1、绘制二次样条曲线 :
context.quadraticCurveTo(qcpx,qcpy,qx,qy) :
qcpx:二次样条曲线控制点x坐 标 ,qcpy:二次样条曲线控制点y坐标,qx:二次样条曲线终点x坐标,qy:二次样条曲线终点y坐标。
2、绘制三次样条曲线 :
context.bezierCurveTo(cp1x,cp1y,cp2x,cp2y,x,y):
cp1x:第一个控制点x坐标, cp1y:第一个控制点y坐标, cp2x:第二个控制点x坐标,cp2y:第二个控制点 y坐标,x:终点x坐标 ,y:终点y坐标。
该知识点比较复杂,推荐一篇写的比较好的博客:https://www.cnblogs.com/wxydigua/p/4204254.html
渐变
线性渐变: var lg= context.createLinearGradient(xStart,yStart,xEnd,yEnd)
lg.addColorStop(offset,color);
xStart:渐变起点的x坐标
yStart:渐变起点的y坐标
xEnd:渐变起点的x坐标
yEnd:渐变起点的y坐标
offset:设定的颜色离渐变结束点的偏移量(0~1)
color:绘制时要使用的颜色
var lg=ctx.createLinearGradient(0,0,200,200);
lg.addColorStop(0,"red");
lg.addColorStop(0.5,"green");
lg.addColorStop(1,"blue");
ctx.fillStyle = lg;
ctx.fillRect(0,0,200,200);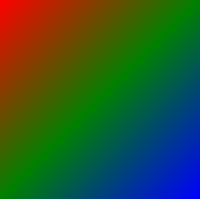
径向渐变: var rg=context.createRadialGradient(xStart,yStart,radiusStart,xEnd,yEnd,radiusEnd)
rg.addColorStop(offset,color)
xStart:发散开始圆心x坐标
yStart:发散开始圆心y坐标
radiusStart:发散开始圆的半径
xEnd:发散 结束圆心的x坐标
yEnd:发散结束圆心的y坐标
radiusEnd:发散结束圆的半径
offset:设定的颜色离渐变结束点的偏移量(0~1)
color:绘制时要使用的颜色
var grd=ctx.createRadialGradient(300,150,10,300,150,150);
grd.addColorStop(0,"red");
grd.addColorStop(0.5,"yellow");
grd.addColorStop(1,"white");
ctx.fillStyle = grd;
ctx.fillRect(0,0,600,300);
ctx.fill(); 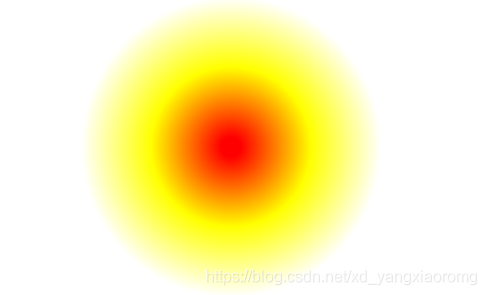
图片背景
运用createPattern方法 :createPattern(image, repetitionStyle)
repetitionStyle可取值:"repeat" - 在各个方向上都对图 像贴图。默认值。 "repeat-x" - 只在 X 方向上贴图。 "repeat-y" - 只在 Y 方向上贴图。 "no-repeat" - 不贴图,只使用它一次。
 var backgroundImg = new Image();
     backgroundImg.src = "./picture/canvas1.jpg";
	 backgroundImg.onload = function (){
		 var bakImg = ctx.createPattern(backgroundImg,"repeat");
		 ctx.fillStyle = bakImg;
		 ctx.fillRect(0,0,600,300);
    }
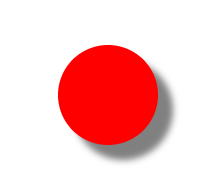
图形阴影
ctx.shadowOffsetX :阴影距形状的水平距离
ctx.shadowOffsetY: 阴影距形状的垂直距离
ctx.shadowBlur阴影的模糊级别,值越大则越模糊
ctx.shadowColor = "red",设置阴影颜色
ctx.arc(200,200,50,0,Math.PI*2,false);
ctx.fillStyle="red";
ctx.shadowOffsetX = 15;
ctx.shadowOffsetY = 15;
ctx.shadowBlur = 10;
ctx.shadowColor = "gray";
ctx.fill();
图形变形
平移 、缩放 、旋转: ralate, scale ,rotate。原理与css的一致。
ctx.translate(100,100);
ctx.rotate(Math.PI/6);
ctx.fillStyle="red";
ctx.fillRect(0,0,150,100);
图形组合
在绘制完成第一个图形之后,加
context.globalCompositeOperation=type
再接着绘制第二个图形
type:
source-over(默认值):在原有图形上绘制新图形
destination-over:在原有图形下绘制新图形
source-in:显示原有图形和新图形的交集,新图形在上,所以颜色为新图形的颜色
destination-in:显示原有图形和新图形的交集,原有图形在上,所以颜色为原有图形的颜色
source-out:只显示新图形非交集部分
destination-out:只显示原有图形非交集部分,是将交集的部分转化为透明
source-atop:显示原有图形和交集部分,新图形在上,所以交集部分的颜色为新图形的颜色
destination-atop:显示新图形和交集部分,新图形在下,所以交集部分的颜色为原有图形的颜 色
lighter:原有图形和新图形都显示,交集部分做颜色叠加
xor:重叠飞部分不现实
copy:只显示新图形
2、下面进行一些实践练习,我们通过绘制一个时钟来练习canvas。
既然要画时钟,要画圆,我们先要了解一些关于canvas画布的规律,如下图所示:
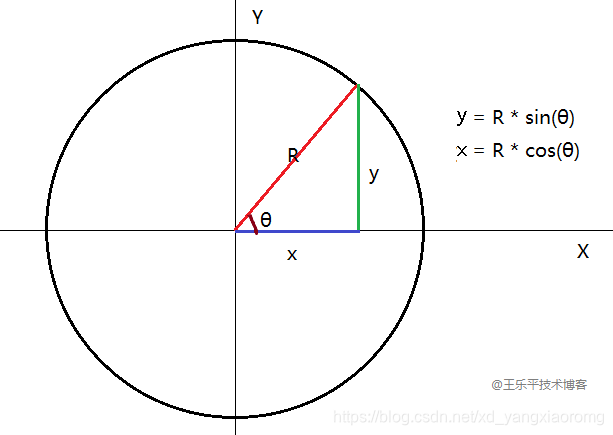
即以坐标轴的x轴正方向为起点,顺时针方向开始,依次是0度,90度,180度,270度,360度(0度),y轴正方向(270度)也可以说是-90度,此时时钟的0点(12点)就在这个位置。有了这些基本知识,我们可以开始简单绘制一个时钟。
<!DOCTYPE html>
<html>
<head>
	<title>canvas</title>
</head>
<body>
	<canvas id="canvas" width="500" height="500" style="border-width:1px;border-style:solid;border-color:red">
		该浏览器不支持canvas!
	</canvas>
	<div class="clock" style="font-size:20px">
		电子时钟:
		<span id="eleClock" style="height:50px;line-height: 50px"></span>
	</div>
	<script type="text/javascript">
		var myCanvas = document.getElementById('canvas');
		var context = myCanvas.getContext('2d');
		var Radius=200,//圆圈的半径
		    FontSize=20,//字体大小
		    space=20,//为了让数字里圆圈有一定的距离,要给一个间距
		    HourLength=80,//时针的长度
		    MinuteLength=130,//分针的长度
		    SecondLength=160;//秒针的长度

		var eleClockValue=''//电子时钟的时刻

		function drawCircle(){//画圆圈
			context.beginPath();
			context.arc(myCanvas.width/2,myCanvas.height/2,Radius,0,Math.PI*2,true);
			context.stroke();
		}

		function drawNumbers(){//给时钟画上数字
			var numbers=[1,2,3,4,5,6,7,8,9,10,11,12],
				angle=0;
				//两个刻度之间相差30°,1,2,3,……,12每一个数字在坐标轴上的位置分别是-60°,-30°,0°,30°,……,270°
				numbers.forEach(function(number){//
					angle=Math.PI/6*(number-3);//30°*(number-3)
					/**myCanvas.width/2+Math.cos(angle)*(Radius+space):数字在画布上的x轴坐标
					myCanvas.height/2+Math.sin(angle)*(Radius+space):数字在画布上的y轴坐标
					context.measureText(text).width:在画布上输出文本之前,检查字体的宽度
					*/
					numberWidth=context.measureText(number).width;

					context.fillText(number,myCanvas.width/2+Math.cos(angle)*(Radius+space)-numberWidth/2,myCanvas.height/2+Math.sin(angle)*(Radius+space)+FontSize/3)
				})

		}
		function drawCenter(){//绘制时钟的圆心
			context.beginPath();
			context.arc(myCanvas.width/2,myCanvas.height/2,5,0,Math.PI*2,true);
			context.stroke();
		}
		function drawHand(deg,type){//根据传参在时钟上绘制时针,分针,秒针
			var angle=0,length=0;
			if(type==='hour'){//时针
			  length=HourLength
			}else if(type==='minute'){
			   length=MinuteLength
			}else{
			   length=SecondLength
			}
			context.moveTo(myCanvas.width/2,myCanvas.height/2);
			context.lineTo(myCanvas.width/2+Math.cos(deg)*length,myCanvas.height/2+Math.sin(deg)*length);
			context.stroke();
		}

		function drawHands(){//获取当前系统时间,得到绘制时针,分针,秒针所需的参数
			var date= new Date(),
			    hour=date.getHours(),
			    minute = date.getMinutes(),
			    second = date.getSeconds();
			hour=hour>12?hour-12:hour;
			//Math.PI/180等于1度
			var deg=Math.PI/180;
			//两个时刻是30度,被分成5格,每格6度,时钟每走12分钟,时针就走一小格,所以对时针而言,分针每走一分钟,时针就多走1/2度
			var hourDeg=Math.PI/6*(hour-3)+minute/2*deg;
			//分针一小时走完360度,1小时=60分钟,所以每走一分钟就走6度
			var minuteDeg=Math.PI/6*(minute/5-3);
			// 秒针一分钟走完360度,1分钟=60秒,所以每走一秒就走6度
			var SecondDeg=Math.PI/6*(second/5-3);
			drawHand(hourDeg,'hour')
			drawHand(minuteDeg,'minute')
			drawHand(SecondDeg,'second')

			eleClockValue=hour+' : '+minute+' : '+second
		}

		function drawClock(){
			context.clearRect(0,0,myCanvas.width,myCanvas.height);//每画下一秒的时钟图像之前要把画布清空
			drawCircle();
			drawNumbers();
			drawCenter();
			drawHands();
		}
		context.font=FontSize+"px Arial"
		setInterval(function(){
			drawClock();
			var eleClock=document.getElementById('eleClock')
			eleClock.innerHTML=eleClockValue
		},1000)//1s重绘一次时钟

	</script>
</body>
</html>
效果如下图所示:
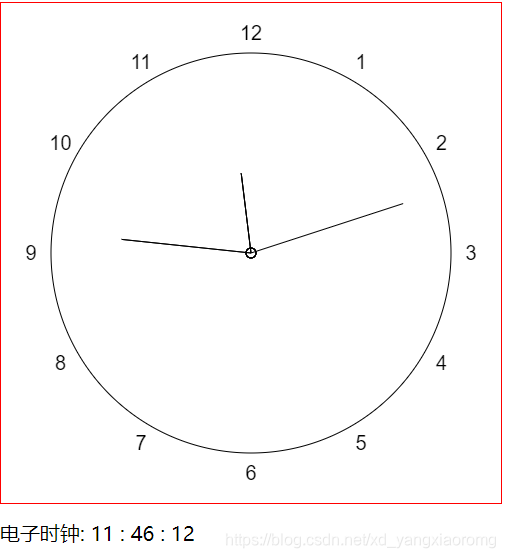
现在一个可以跑的简陋时钟就绘制完成了,但是是真的丑,一点都体现不出canvas强大的绘画功能。为了体现canvas的强大,贴一个我很早之前画的时钟的代码。canvas的坐标轴中心在画布的左上角,这个方法将坐标系的中心从左上角移到了坐标轴的(200,200)位置,这一步为我们省去了很多复杂的计算,不需要再去自己微调数字和刻度盘在圆圈周围的位置,计算直观了很多。
<!DOCTYPE html>
<html>
<head>
	<title>clock</title>
	<meta charset="utf-8">
</head>
<body>
<canvas id="clock" width="400" height="400" style="border:1px solid red">
	you can't see me!
</canvas>
<script type="text/javascript">
	var clock=document.getElementById("clock");
	var ctx=clock.getContext('2d');
	var width=ctx.canvas.width;
	var height=ctx.canvas.height;
	var r=width/3;

	function circle(){
		ctx.save();
		ctx.translate(200,200);//将坐标系的中心由左上角挪到坐标(200,200),这样可以省去很多繁琐的计算
		ctx.beginPath();
		ctx.arc(0,0,r,0,Math.PI*2,false);
		ctx.lineWidth="5";
		ctx.strokeStyle="black";
		ctx.stroke();
		ctx.closePath();
		// ctx.save();
		// ctx.restore();

		//画数字
		var Arr=[3,4,5,6,7,8,9,10,11,12,1,2];
		for(var i=0;i<12;i++){
			var rad=2*Math.PI/12*i;
			var x=Math.cos(rad)*(r-30);
			var y=Math.sin(rad)*(r-30);
			ctx.beginPath();
			ctx.font="18 Arial";
			ctx.textAlign="center";
			ctx.textBaseline="middle";
			ctx.fillText(Arr[i],x,y);
			ctx.closePath();
		}
		//画刻度
		for(var i=0;i<60;i++){
			var rad=2*Math.PI/60*i;
			var x=Math.cos(rad)*(r-18);
			var y=Math.sin(rad)*(r-18);
			ctx.beginPath();
			if(i%5==0){
				ctx.fillStyle="red";
				ctx.arc(x,y,2,0,Math.PI*2);
				ctx.fill();
			}
			else{
				ctx.fillStyle="grey";
				ctx.arc(x,y,1,0,Math.PI*2);
				ctx.fill();
			}
			ctx.closePath();
		}


	}
	//画时针
	function hours(hour,minute,second){
		ctx.save();
		ctx.beginPath();
		var rad=Math.PI*2/12*hour;
		var mrad = 2*Math.PI/12/60*minute;
		var srad=2*Math.PI/12/60/60*second;
		ctx.rotate(rad+mrad+srad);
		ctx.moveTo(0,5);
		ctx.lineTo(0,-r+60);
		ctx.lineCap="round";
		ctx.strokeStyle="red";
		ctx.stroke();
		ctx.restore();
	}
	function minutes(minute,second){
		ctx.save();
		ctx.beginPath();
		var rad=Math.PI*2/60*minute;
		var srad=Math.PI*2/60/60*second;

		ctx.rotate(rad+srad);
		ctx.moveTo(0,5);
		ctx.lineTo(0,-r+50);
		ctx.lineWidth="4";
		ctx.lineCap="round";
		ctx.strokeStyle="grey";
		ctx.stroke();
		ctx.restore();
	}
	function seconds(second){
		ctx.save();
		ctx.beginPath();
		var rad=Math.PI*2/60*second;
		ctx.rotate(rad);
		ctx.moveTo(0,5);
		ctx.lineTo(0,-r+30);
		ctx.lineWidth="2";
		ctx.lineCap="round";
		ctx.stroke();
		ctx.restore();
	}
	function showTime(){
		ctx.clearRect(0,0,width,height);
		var date=new Date();
		var myHour=date.getHours();
		var myMinute=date.getMinutes();
		var mySecond=date.getSeconds();
		circle();
		hours(myHour,myMinute,mySecond);
		minutes(myMinute,mySecond);
		seconds(mySecond);
		ctx.restore();

	}

	showTime();//页面初始化时画一次,避免页面打开时一秒的空白
	setInterval(showTime,1000);


</script>
</body>
</html>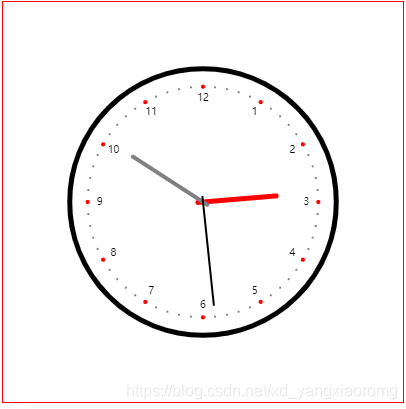
后续内容,请看 canvas进阶(1):Canvas元素大小与绘图表面大小的区别。


 110
110

 被折叠的 条评论
为什么被折叠?
被折叠的 条评论
为什么被折叠?
 到【灌水乐园】发言


