


效果图:
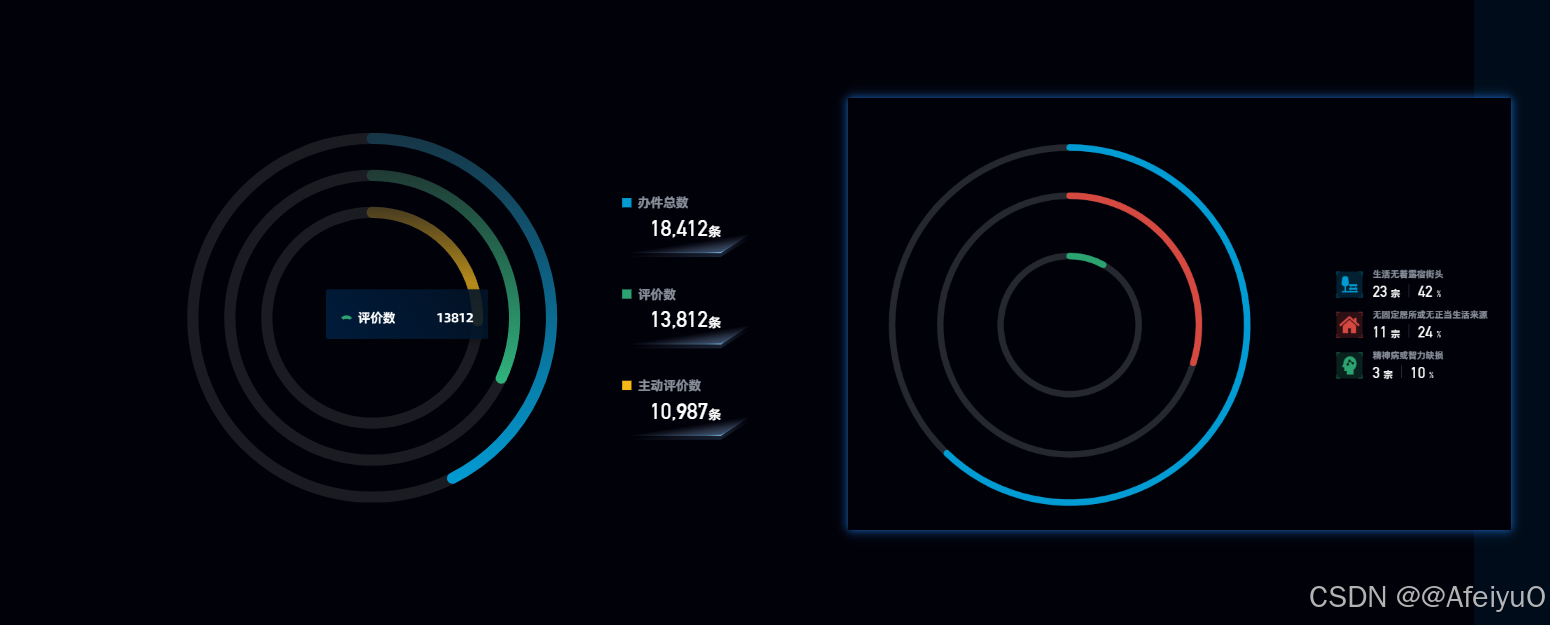
第一个环形
<template>
  <div class="go-MultiPie">
    <div class="left-box" ref="leftBox">
      <v-chart
        ref="vChartRef"
        :option="option"
        style="width: 100%; height: 200px"
      >
      </v-chart>
    </div>
    <div class="right-box">
      <div v-for="(item, index) in chartData" :key="index" class="legend-box">
        <div class="legend-box-top">
          <span
            class="square-icon"
            :style="{
              'background-color': colorConfig[index]
                ? colorConfig[index].colorStops[1].color
                : '',
            }"
          ></span>
          {{ item.name }}
        </div>
        <div class="legend-box-center">
          <div>
            <span>{{ item.value }}</span>
            <span>{{ "条" }}</span>
          </div>
          <img src="../../../assets/images/ring/hcp-bg.png" alt="" />
        </div>
      </div>
    </div>
  </div>
</template>

<script setup lang="ts">
import { ref, onMounted, reactive, computed } from "vue";
import VChart from "vue-echarts";
import { use } from "echarts/core";
import { CanvasRenderer } from "echarts/renderers";
import { GaugeChart } from "echarts/charts";
import { TooltipComponent } from "echarts/components";

use([CanvasRenderer, GaugeChart, TooltipComponent]);

// 获取图表实例
const vChartRef = ref();
const leftBox = ref(null);

const chartData = ref([
  {
    name: "办件总数",
    value: "18412",
  },
  {
    name: "评价数",
    value: "13812",
  },
  {
    name: "主动评价数",
    value: "10987",
  },
]);

// 定义每个环形图的最大值
const maxValues = [35000, 30000, 30000];

const colorConfig = [
  {
    type: "radial",
    x: 0,
    y: 0,
    x2: 0,
    y2: 1,
    colorStops: [
      { offset: 0, color: "rgba(2, 156, 212, 0.2)" },
      { offset: 1, color: "rgba(2, 156, 212, 1)" },
    ],
    global: false,
  },
  {
    type: "radial",
    x: 0,
    y: 0,
    x2: 0,
    y2: 1,
    colorStops: [
      { offset: 0, color: "rgba(43, 164, 113, 0.2)" },
      { offset: 1, color: "rgba(43, 164, 113, 1)" },
    ],
    global: false,
  },
  {
    type: "radial",
    x: 0,
    y: 0,
    x2: 0,
    y2: 1,
    colorStops: [
      { offset: 0, color: "rgba(245, 186, 24, 0.2)" },
      { offset: 1, color: "rgba(245, 186, 24, 1)" },
    ],
    global: false,
  },
];

// 定义 series 数据生成函数
const getSeriesData = (color: any[]) => {
  return chartData.value.map((item, index) => [
    {
      value: parseFloat(item.value),
      itemStyle: {
        color: color[index],
      },
    },
  ]);
};

// 构建系列数据
const buildSeries = () => {
  return chartData.value.map((item, index) => {
    // 不同环的半径配置
    const radiusConfig = [
      { radius: "100%", max: maxValues[0] },
      { radius: "80%", max: maxValues[1] },
      { radius: "60%", max: maxValues[2] },
    ];

    return {
      name: item.name,
      type: "gauge",
      startAngle: 90,
      endAngle: -270,
      center: ["50%", "50%"],
      radius: radiusConfig[index]?.radius || "60%",
      max: radiusConfig[index]?.max || maxValues[index] || 1000,
      pointer: {
        show: false,
      },
      progress: {
        show: true,
        overlap: false,
        clip: false,
        width: 10,
        itemStyle: {
          borderCap: "square",
        },
      },
      axisLine: {
        lineStyle: {
          color: [[1, "rgba(255, 255, 255, 0.1)"]],
          width: 12,
        },
      },
      axisTick: { show: false },
      splitLine: { show: false },
      axisLabel: { show: false },
      title: { show: false },
      detail: { show: false },
      data: getSeriesData(colorConfig)[index] || [],
    };
  });
};

const option: any = reactive({
  tooltip: {
    trigger: "item",
    backgroundColor: "transparent",
    borderWidth: 0,
    padding: 0,
    textStyle: {
      color: "transparent",
      fontSize: 0,
    },
    extraCssText:
      "background: transparent; border: none; box-shadow: none; padding: 0;",
    formatter: function (params: any) {
      return generateTooltipContent(params);
    },
  },
  color: colorConfig,
  series: buildSeries(),
});

// 自定义tooltip样式
const generateTooltipContent = (params: any) => {
  // 自定义仪表盘图标路径
  const dashboardIconPath =
    "M505.408 320a638.72 638.72 0 0 1 496.896 236.608l-192.832 156.544A637.248 637.248 0 0 0 512 640c-106.752 0-207.36 26.112-295.872 72.32L19.2 543.808A638.592 638.592 0 0 1 505.408 320z";

  // 获取数据项颜色
  const itemColor =
    params.color && params.color.colorStops
      ? params.color.colorStops[1].color
      : params.color;

  // 使用 viewBox 确保 SVG 正确显示
  return `
    <div style="min-width:142px;padding:12px 16px;background-image: linear-gradient(239deg, #021326e6 0%, #001e40e6 100%);box-shadow: 0 5px 5px -3px #0000001a, 0 8px 10px 1px #0000000f, 0 3px 14px 2px #0000000d;border-radius: 2px;font-family:AlibabaPuHuiTi_2_85_Bold;letter-spacing: -0.25px;">
      <p style="color: #fff;margin-bottom: 8px;">${params.seriesName}</p>
      <ul style="padding:0">
        <li style="display: flex;align-items: center;justify-content: space-between;color: #fff;font-size:14px;">
          <span style="display: flex;align-items: center;">
            <svg width="12" height="12" viewBox="0 0 1024 1024" style="margin-right: 6px; flex-shrink: 0;">
              <path d="${dashboardIconPath}" fill="${itemColor}" />
            </svg>
            ${params.name}
          </span>
          <span style="margin-left:6px">${params.value}</span>
        </li>
      </ul>
    </div>
  `;
};

// 监听数据变化,更新图表
const updateChart = () => {
  option.series = buildSeries();
};

// 数据变化时更新图表
onMounted(() => {
  updateChart();
});
</script>

<style lang="scss" scoped>
.go-MultiPie {
  width: 30%;
  height: 100%;
  display: flex;
  flex-direction: row;
  justify-content: flex-start;
  align-items: center;
  background-color: #000;
  .left-box {
    width: calc(100% - 46px - 136px);
    height: 100%;
    margin-right: 46px;
    position: relative;
  }
  .right-box {
    display: flex;
    flex-direction: column;
  }
  .legend-box {
    width: 136px;
    height: 66px;
    margin-bottom: 32px;
  }
  .legend-box:nth-child(3n) {
    margin-bottom: 0px !important;
  }
  .legend-box-top {
    color: #e6f1ff99;
    line-height: 16px;
  }
  .square-icon {
    display: inline-block;
    margin-right: 7px;
    width: 10px;
    height: 10px;
  }
  .legend-box-center {
    width: 100%;
    height: 50px;
    text-align: center;
    position: relative;
    span:nth-child(1) {
      font-family: DINAlternate-Bold;
      font-size: 24px;
      color: #ffffff;
      letter-spacing: -0.21px;
    }
    span:nth-child(2) {
      color: #ffffff;
    }
    img {
      width: 100%;
      position: absolute;
      bottom: 0px;
      right: 0px;
    }
  }
}
</style>
第二个环图
<template>
  <div class="go-MultiPie02">
    <div class="left-box">
      <v-chart ref="vChartRef" :option="option"> </v-chart>
    </div>

    <div class="right-box">
      <div class="right-inner-box">
        <div v-for="(item, index) in chartData" :key="index" class="legend-box">
          <div class="legend-left-box">
            <div class="legend-left-bg-box">
              <img :src="item.imageUrl" />
            </div>
          </div>
          <div class="legend-right-box">
            <div class="legend-right-top">
              {{ item.name }}
            </div>
            <div class="legend-right-bottom">
              {{ numberToCurrency(item.value) }}
              <span class="unit">{{ option.unit1 }}</span>
              <span class="split-line"></span>
              {{ item.zb }}
              <span class="unit">{{ option.unit2 }}</span>
            </div>
          </div>
        </div>
      </div>
    </div>
  </div>
</template>
<script setup lang="ts">
import { ref, onMounted, getCurrentInstance, reactive } from "vue";
import VChart from "vue-echarts";
import { use } from "echarts/core";
import { CanvasRenderer } from "echarts/renderers";
import { GaugeChart } from "echarts/charts";
import {
  DatasetComponent,
  GridComponent,
  TooltipComponent,
  LegendComponent,
} from "echarts/components";

const { proxy }: any = getCurrentInstance();
const numberToCurrency =
  proxy?.$filters?.numberToCurrency || ((value: any) => value);
use([
  DatasetComponent,
  CanvasRenderer,
  GaugeChart,
  GridComponent,
  TooltipComponent,
  LegendComponent,
]);

// 获取图表实例
const vChartRef = ref();

const chartData = ref([
  {
    name: "生活无着露宿街头",
    value: "23",
    zb: "42",
    imageUrl: require("@/assets/images/ring/3.png"),
  },
  {
    name: "无固定居所或无正当生活来源",
    value: "11",
    zb: "24",
    imageUrl: require("@/assets/images/ring/1.png"),
  },
  {
    name: "精神病或智力缺损",
    value: "3",
    zb: "10",
    imageUrl: require("@/assets/images/ring/2.png"),
  },
]);

// 定义每个环形图的最大值
const maxValues = [1000, 30000, 30000];
// 组装环形图series数据
const buildSeries = () => {
  let totalValue = chartData.value
    .map((i: any) => Number(i.value))
    .reduce((pre: any, nex: any) => {
      return pre + nex;
    }, 0);
  // 不同环的半径配置
  const radiusConfig = [
    { radius: "75%", max: maxValues[0] },
    { radius: "55%", max: maxValues[1] },
    { radius: "30%", max: maxValues[2] },
  ];
  return chartData.value.map((item, index) => {
    return {
      name: item.name,
      type: "gauge",
      startAngle: 90,
      endAngle: -270,
      center: ["50%", "50%"],
      radius: radiusConfig[index]?.radius,
      max: totalValue,
      pointer: {
        show: false,
      },
      progress: {
        show: true,
        overlap: false,
        clip: false,
        roundCap: true,
      },
      axisLine: {
        lineStyle: {
          color: [[1, "rgba(255, 255, 255, 0.1)"]], //每个环背景颜色灰色
          width: 10,
        },
      },
      axisTick: {
        show: false,
      },
      splitLine: {
        show: false,
      },
      axisLabel: {
        show: false,
      },
      title: {
        show: false,
      },
      detail: {
        show: false,
      },
      data: [item],
    };
  });
};

const option = reactive({
  unit1: "宗",
  unit2: "%",
  chartName: "环形图",
  tooltip: {
    trigger: "item",
    formatter: (params: any) => {
      return tooltipPieHover({ ...params }, params.seriesIndex, option);
    },
    backgroundColor: "transparent",
    borderWidth: 0,
    padding: 0,
    confine: true,
  },
  color: ["#029CD4FF", "#D54941FF", "#2BA471FF"],
  series: buildSeries(),
});

const tooltipPieHover = (params: any, index: number, opts: any) => {
  // 自定义仪表盘图标路径
  const dashboardIconPath =
    "M505.408 320a638.72 638.72 0 0 1 496.896 236.608l-192.832 156.544A637.248 637.248 0 0 0 512 640c-106.752 0-207.36 26.112-295.872 72.32L19.2 543.808A638.592 638.592 0 0 1 505.408 320z";

  let tooltipContent = `
    <div style="min-width:142px;padding:12px 16px;background-image: linear-gradient(239deg, #021326e6 0%, #001e40e6 100%);box-shadow: 0 5px 5px -3px #0000001a, 0 8px 10px 1px #0000000f, 0 3px 14px 2px #0000000d;border-radius: 2px;font-family:AlibabaPuHuiTi_2_85_Bold;letter-spacing: -0.25px;">
      <ul style="padding:0">
        <li style="display: flex;align-items: center;justify-content: space-between;color: #fff;font-size:14px;">
          <span style="display: flex;align-items: center;">
            <svg width="12" height="12" viewBox="0 0 1024 1024" style="margin-right: 6px; flex-shrink: 0;">
              <path d="${dashboardIconPath}" fill="${params.color}" />
            </svg>
            ${params.name}
          </span>
          <span style="margin-left:6px">${params.value}${
    opts.totalUnit || ""
  }</span>
        </li>
      </ul>
    </div>
  `;

  return tooltipContent;
};

onMounted(() => {});
</script>

<style lang="scss" scoped>
.go-MultiPie02 {
  width: 100% !important;
  height: 100% !important;
  display: flex;
  flex-direction: row;
  //   justify-content: space-between;
  align-items: center;
  position: relative;
  .left-box {
    // min-width: 212px;
    width: calc(100% - 46px - 200px);
    height: 100%;
    // margin-right: 46px;
    position: relative;
    background-color: #000;
  }
  .right-box {
    // width: 240px;
    height: 100%;
    background-color: #000;
    // overflow-y: auto;
    // position: absolute;
    // left:188px;
    // top:50%;
    // transform:translateY(-50%);
  }
  .right-inner-box {
    width: 100%;
    height: 100%;
    display: flex;
    flex-direction: column;
    justify-content: center;
    // align-items: center;
  }
  .legend-box {
    width: 100%;
    height: 50px;
    margin-bottom: 12px;
    display: flex;
    flex-direction: row;
    justify-content: flex-start;
    align-items: center;
  }
  .legend-box:nth-child(3n) {
    margin-bottom: 0px !important;
  }
  .legend-left-box {
    width: 40px;
    height: 40px;
    // opacity: 0.6;
    // background: #029CD4;
    margin-right: 16px;
    .legend-left-bg-box {
      width: 100%;
      height: 100%;
      img {
        width: 100%;
        height: 100%;
      }
    }
  }
  .legend-right-top {
    color: #e6f1ff99;

    line-height: 20px;
    margin-bottom: 2px;
  }
  .legend-right-bottom {
    font-family: DINAlternate-Bold;

    font-size: 24px;
    color: #ffffff;

    line-height: 28px;
  }
  .split-line {
    width: 1px;
    height: 20px;
    display: inline-block;
    background: #e6f1ff4d;
    margin: 0px 8px 0px 13px;
  }
  .unit {
    color: #ffffff;
    font-size: 14px;
    line-height: 14px;
  }
}
</style>


 3561
3561

 被折叠的 条评论
为什么被折叠?
被折叠的 条评论
为什么被折叠?
 到【灌水乐园】发言


