这篇文章主要讲述Python常用数据分析包Numpy、Pandas、Matplotlib结合MySQL分析数据,前一篇文章 "【python数据挖掘课程】十一.Pandas、Matplotlib结合SQL语句可视化分析" 讲述了MySQL绘图分析的好处,这篇文字进一步加深难度,对数据集进行了对比分析。
数据分析结合SQL语句的效果真的很好,很多大神看到可能会笑话晚辈,但是如果你是数据分析的新人,那我强烈推荐,尤其是结合网络爬虫进行数据分析的。希望这篇文章对你有所帮助,如果文章中存在错误或不足之处,还请高抬贵手~
前文推荐:
【Python数据挖掘课程】一.安装Python及爬虫入门介绍
【Python数据挖掘课程】二.Kmeans聚类数据分析及Anaconda介绍
【Python数据挖掘课程】三.Kmeans聚类代码实现、作业及优化
【Python数据挖掘课程】四.决策树DTC数据分析及鸢尾数据集分析
【Python数据挖掘课程】五.线性回归知识及预测糖尿病实例
【Python数据挖掘课程】六.Numpy、Pandas和Matplotlib包基础知识
【Python数据挖掘课程】七.PCA降维操作及subplot子图绘制
【Python数据挖掘课程】八.关联规则挖掘及Apriori实现购物推荐
【Python数据挖掘课程】九.回归模型LinearRegression简单分析氧化物数据
【python数据挖掘课程】十.Pandas、Matplotlib、PCA绘图实用代码补充
【python数据挖掘课程】十一.Pandas、Matplotlib结合SQL语句可视化分析
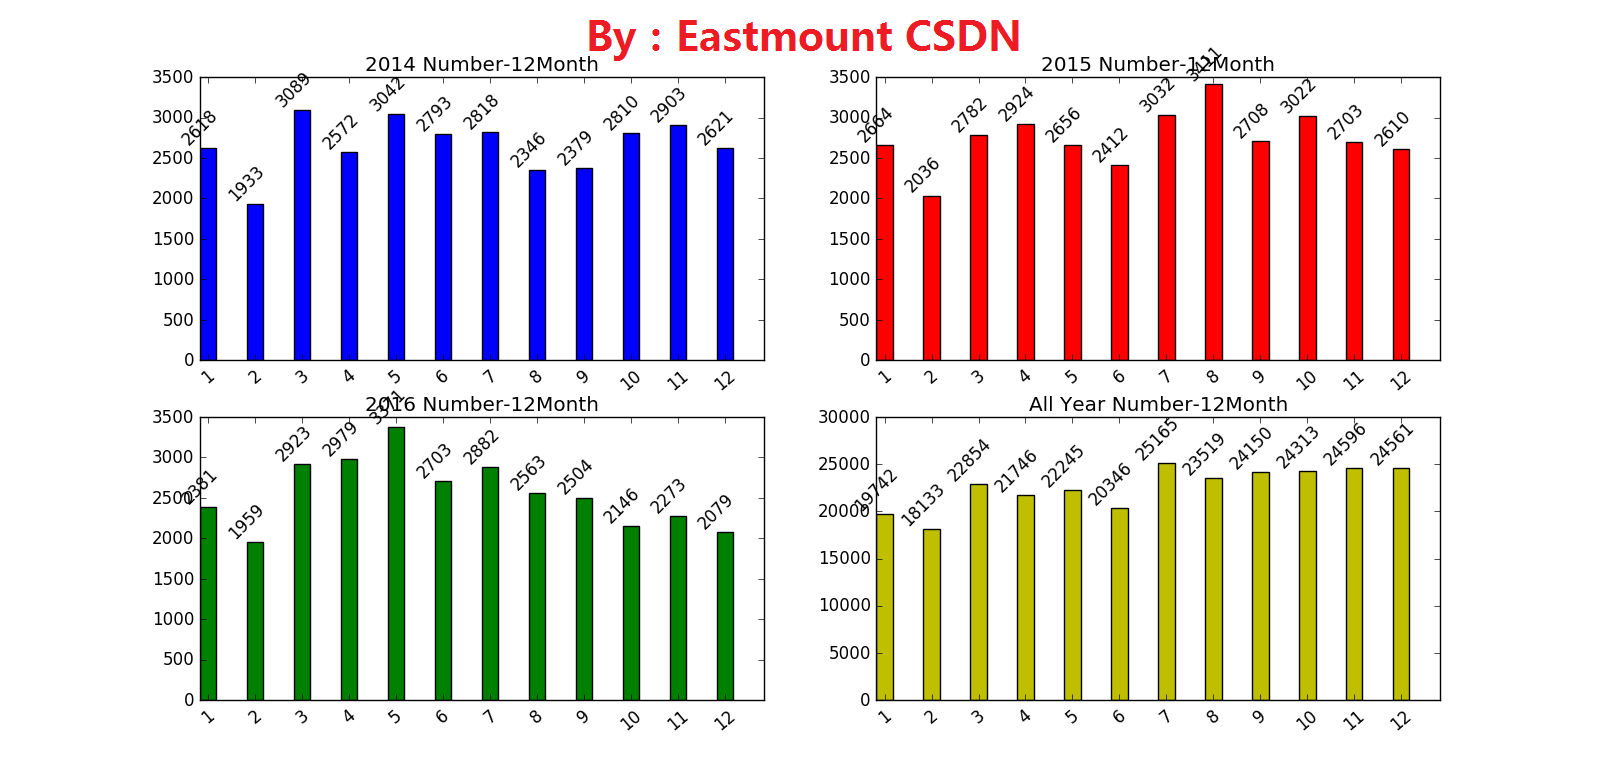
一. 直方图四图对比
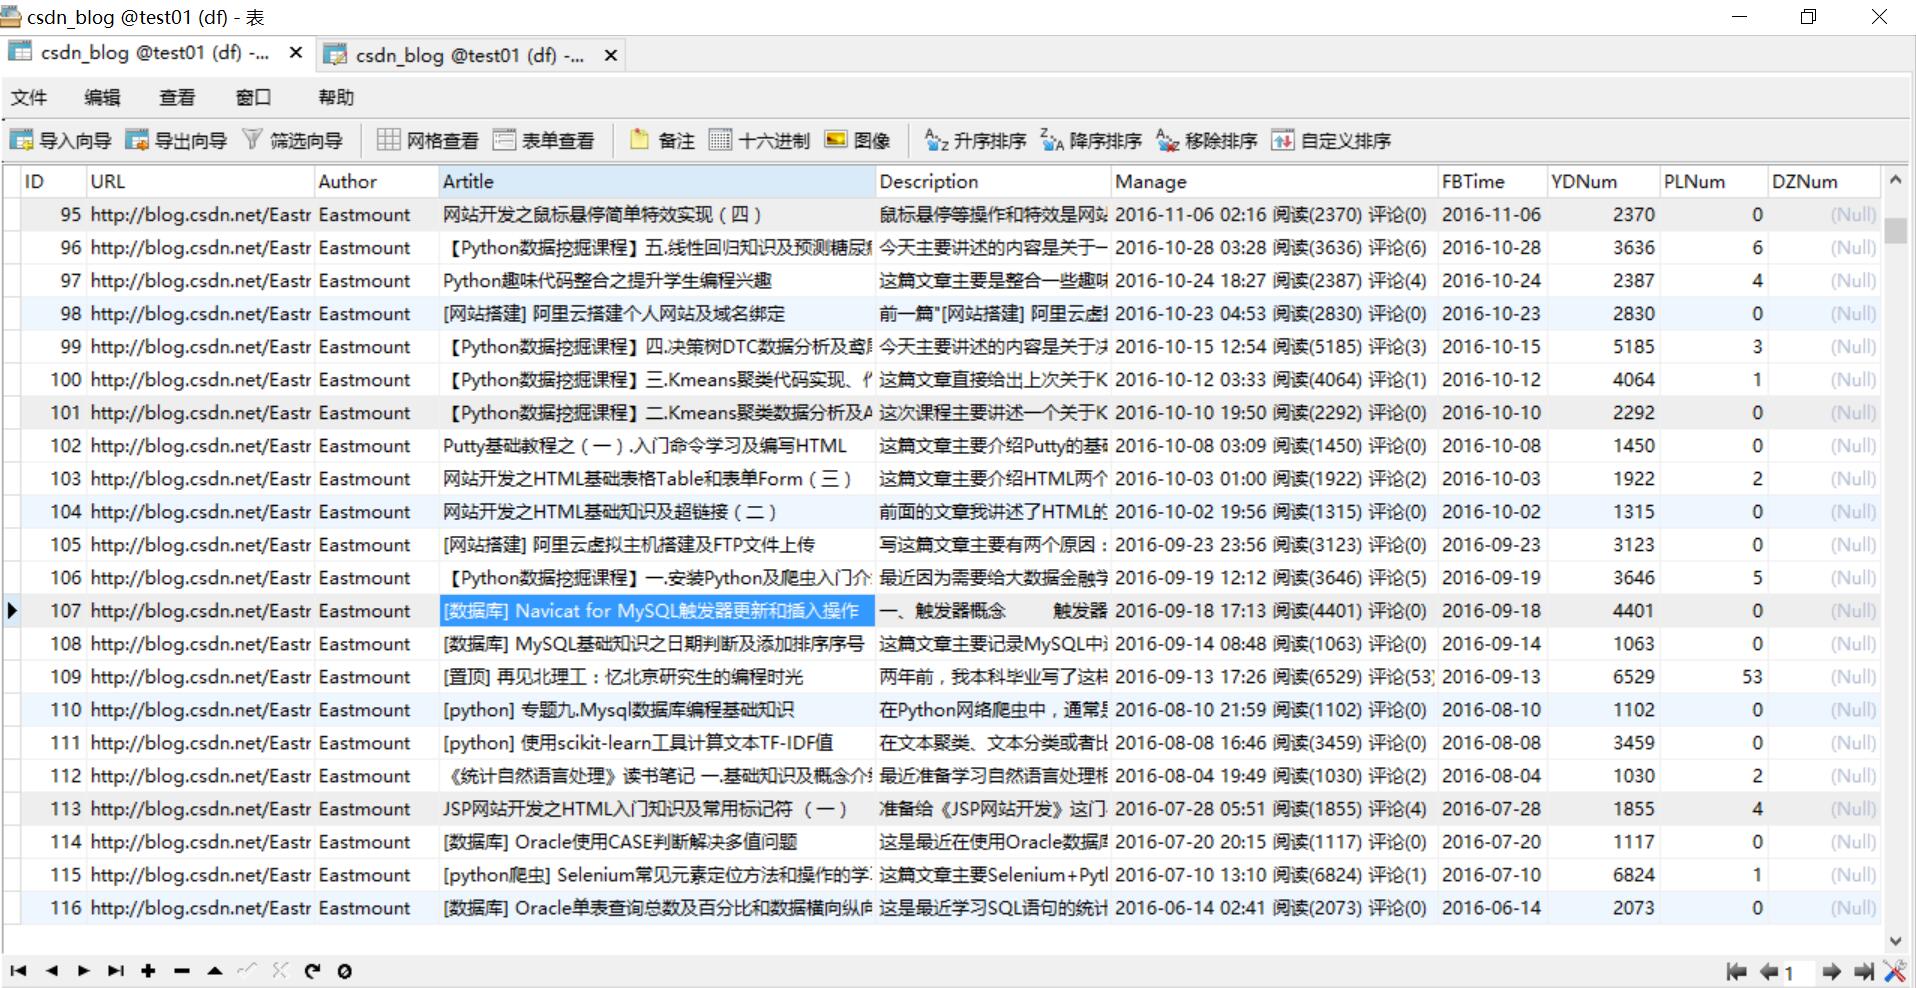
数据库如下所示,包括URL、作者、标题、摘要、日期、阅读量和评论数等。
运行结果如下所示,其中绘制多个图的核心代码为:
p1 = plt.subplot(221)
plt.bar(ind, num1, width, color='b', label='sum num')
plt.sca(p1)
完整代码如下:
-
- ''
-
-
-
-
- import matplotlib.pyplot as plt
- import matplotlib
- import pandas as pd
- import numpy as np
- import pylab
- import MySQLdb
- from pylab import *
-
-
- try:
- conn = MySQLdb.connect(host='localhost',user='root',
- passwd='123456',port=3306, db='test01')
- cur = conn.cursor()
-
-
- conn.set_character_set('utf8')
- cur.execute('SET NAMES utf8;')
- cur.execute('SET CHARACTER SET utf8;')
- cur.execute('SET character_set_connection=utf8;')
-
-
-
-
-
- sql = ''
-
- cur.execute(sql)
- result = cur.fetchall()
- hour1 = [n[0] for n in result]
- print hour1
- num1 = [n[1] for n in result]
- print num1
-
- N = 12
- ind = np.arange(N)
- width=0.35
- p1 = plt.subplot(221)
- plt.bar(ind, num1, width, color='b', label='sum num')
-
- plt.xticks(ind+width/2, hour1, rotation=40)
- for i in range(12):
- plt.text(i, num1[i], str(num1[i]),
- ha='center', va='bottom', rotation=45)
- plt.title('2014 Number-12Month')
- plt.sca(p1)
-
-
-
-
-
- sql = ''
-
- cur.execute(sql)
- result = cur.fetchall()
- hour1 = [n[0] for n in result]
- print hour1
- num1 = [n[1] for n in result]
- print num1
-
- N = 12
- ind = np.arange(N)
- width=0.35
- p2 = plt.subplot(222)
- plt.bar(ind, num1, width, color='r', label='sum num')
-
- plt.xticks(ind+width/2, hour1, rotation=40)
- for i in range(12):
- plt.text(i, num1[i], str(num1[i]),
- ha='center', va='bottom', rotation=45)
- plt.title('2015 Number-12Month')
- plt.sca(p2)
-
-
-
-
-
- sql = ''
-
- cur.execute(sql)
- result = cur.fetchall()
- hour1 = [n[0] for n in result]
- print hour1
- num1 = [n[1] for n in result]
- print num1
-
- N = 12
- ind = np.arange(N)
- width=0.35
- p3 = plt.subplot(223)
- plt.bar(ind, num1, width, color='g', label='sum num')
-
- plt.xticks(ind+width/2, hour1, rotation=40)
- for i in range(12):
- plt.text(i, num1[i], str(num1[i]),
- ha='center', va='bottom', rotation=45)
- plt.title('2016 Number-12Month')
- plt.sca(p3)
-
-
-
-
-
- sql = ''
- cur.execute(sql)
- result = cur.fetchall()
- hour1 = [n[0] for n in result]
- print hour1
- num1 = [n[1] for n in result]
- print num1
-
- N = 12
- ind = np.arange(N)
- width=0.35
- p4 = plt.subplot(224)
- plt.bar(ind, num1, width, color='y', label='sum num')
-
- plt.xticks(ind+width/2, hour1, rotation=40)
- for i in range(12):
- plt.text(i, num1[i], str(num1[i]),
- ha='center', va='bottom', rotation=45)
- plt.title('All Year Number-12Month')
- plt.sca(p4)
-
- plt.savefig('ttt.png',dpi=400)
- plt.show()
-
-
- except MySQLdb.Error,e:
- print "Mysql Error %d: %s" % (e.args[0], e.args[1])
- finally:
- cur.close()
- conn.commit()
- conn.close()
二. Area Plot图对比
运行效果如下所示,核心代码如下:
data = np.array([num1, num2, num3, num4])
d = data.T #转置 12*4
df = DataFrame(d, index=hour1, columns=['All','2014', '2015', '2016'])
df.plot(kind='area', alpha=0.2) #设置颜色 透明度
plt.savefig('csdn.png',dpi=400)
plt.show()
其中需要将num1~num4合并为[12,4]数组,同时转换为array,再转置绘图。index是设置X轴时间,columns是设置每行数据对应的值。kind='area'设置Area Plot图,还有 'bar'(柱状图)、'barh'(柱状图-纵向)、'scatter'(散点图)、'pie'(饼图)。
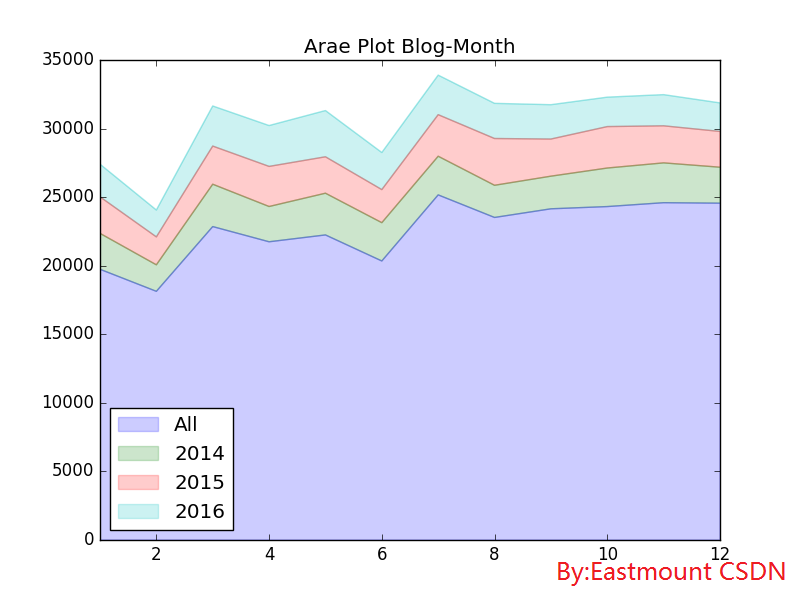
该图会将数据划分为等级梯度,基本趋势相同。
完整代码如下所示:
-
- ''
-
-
-
-
- import matplotlib.pyplot as plt
- import matplotlib
- import pandas as pd
- import numpy as np
- import MySQLdb
- from pandas import *
-
- try:
- conn = MySQLdb.connect(host='localhost',user='root',
- passwd='123456',port=3306, db='test01')
- cur = conn.cursor()
-
-
- conn.set_character_set('utf8')
- cur.execute('SET NAMES utf8;')
- cur.execute('SET CHARACTER SET utf8;')
- cur.execute('SET character_set_connection=utf8;')
-
-
- sql = ''
-
- cur.execute(sql)
- result = cur.fetchall()
- hour1 = [n[0] for n in result]
- print hour1
- num1 = [n[1] for n in result]
- print num1
-
-
- sql = ''
-
- cur.execute(sql)
- result = cur.fetchall()
- num2 = [n[1] for n in result]
- print num2
-
-
- sql = ''
-
- cur.execute(sql)
- result = cur.fetchall()
- num3 = [n[1] for n in result]
- print num3
-
-
- sql = ''
-
- cur.execute(sql)
- result = cur.fetchall()
- num4 = [n[1] for n in result]
- print num4
-
-
- data = np.array([num1, num2, num3, num4])
- print data
- d = data.T
- print d
- df = DataFrame(d, index=hour1, columns=['All','2014', '2015', '2016'])
- df.plot(kind='area', alpha=0.2)
- plt.title('Arae Plot Blog-Month')
- plt.savefig('csdn.png',dpi=400)
- plt.show()
-
-
- except MySQLdb.Error,e:
- print "Mysql Error %d: %s" % (e.args[0], e.args[1])
- finally:
- cur.close()
- conn.commit()
- conn.close()
-
三. MySQL语句获取星期信息
MySQL通过日期获取星期的语句如下:
- select now(), case dayofweek(now())
- when 1 then '星期日'
- when 2 then '星期一'
- when 3 then '星期二'
- when 4 then '星期三'
- when 5 then '星期四'
- when 6 then '星期五'
- when 7 then '星期六' end as 'week'
- from dual;
输出如下图所示:
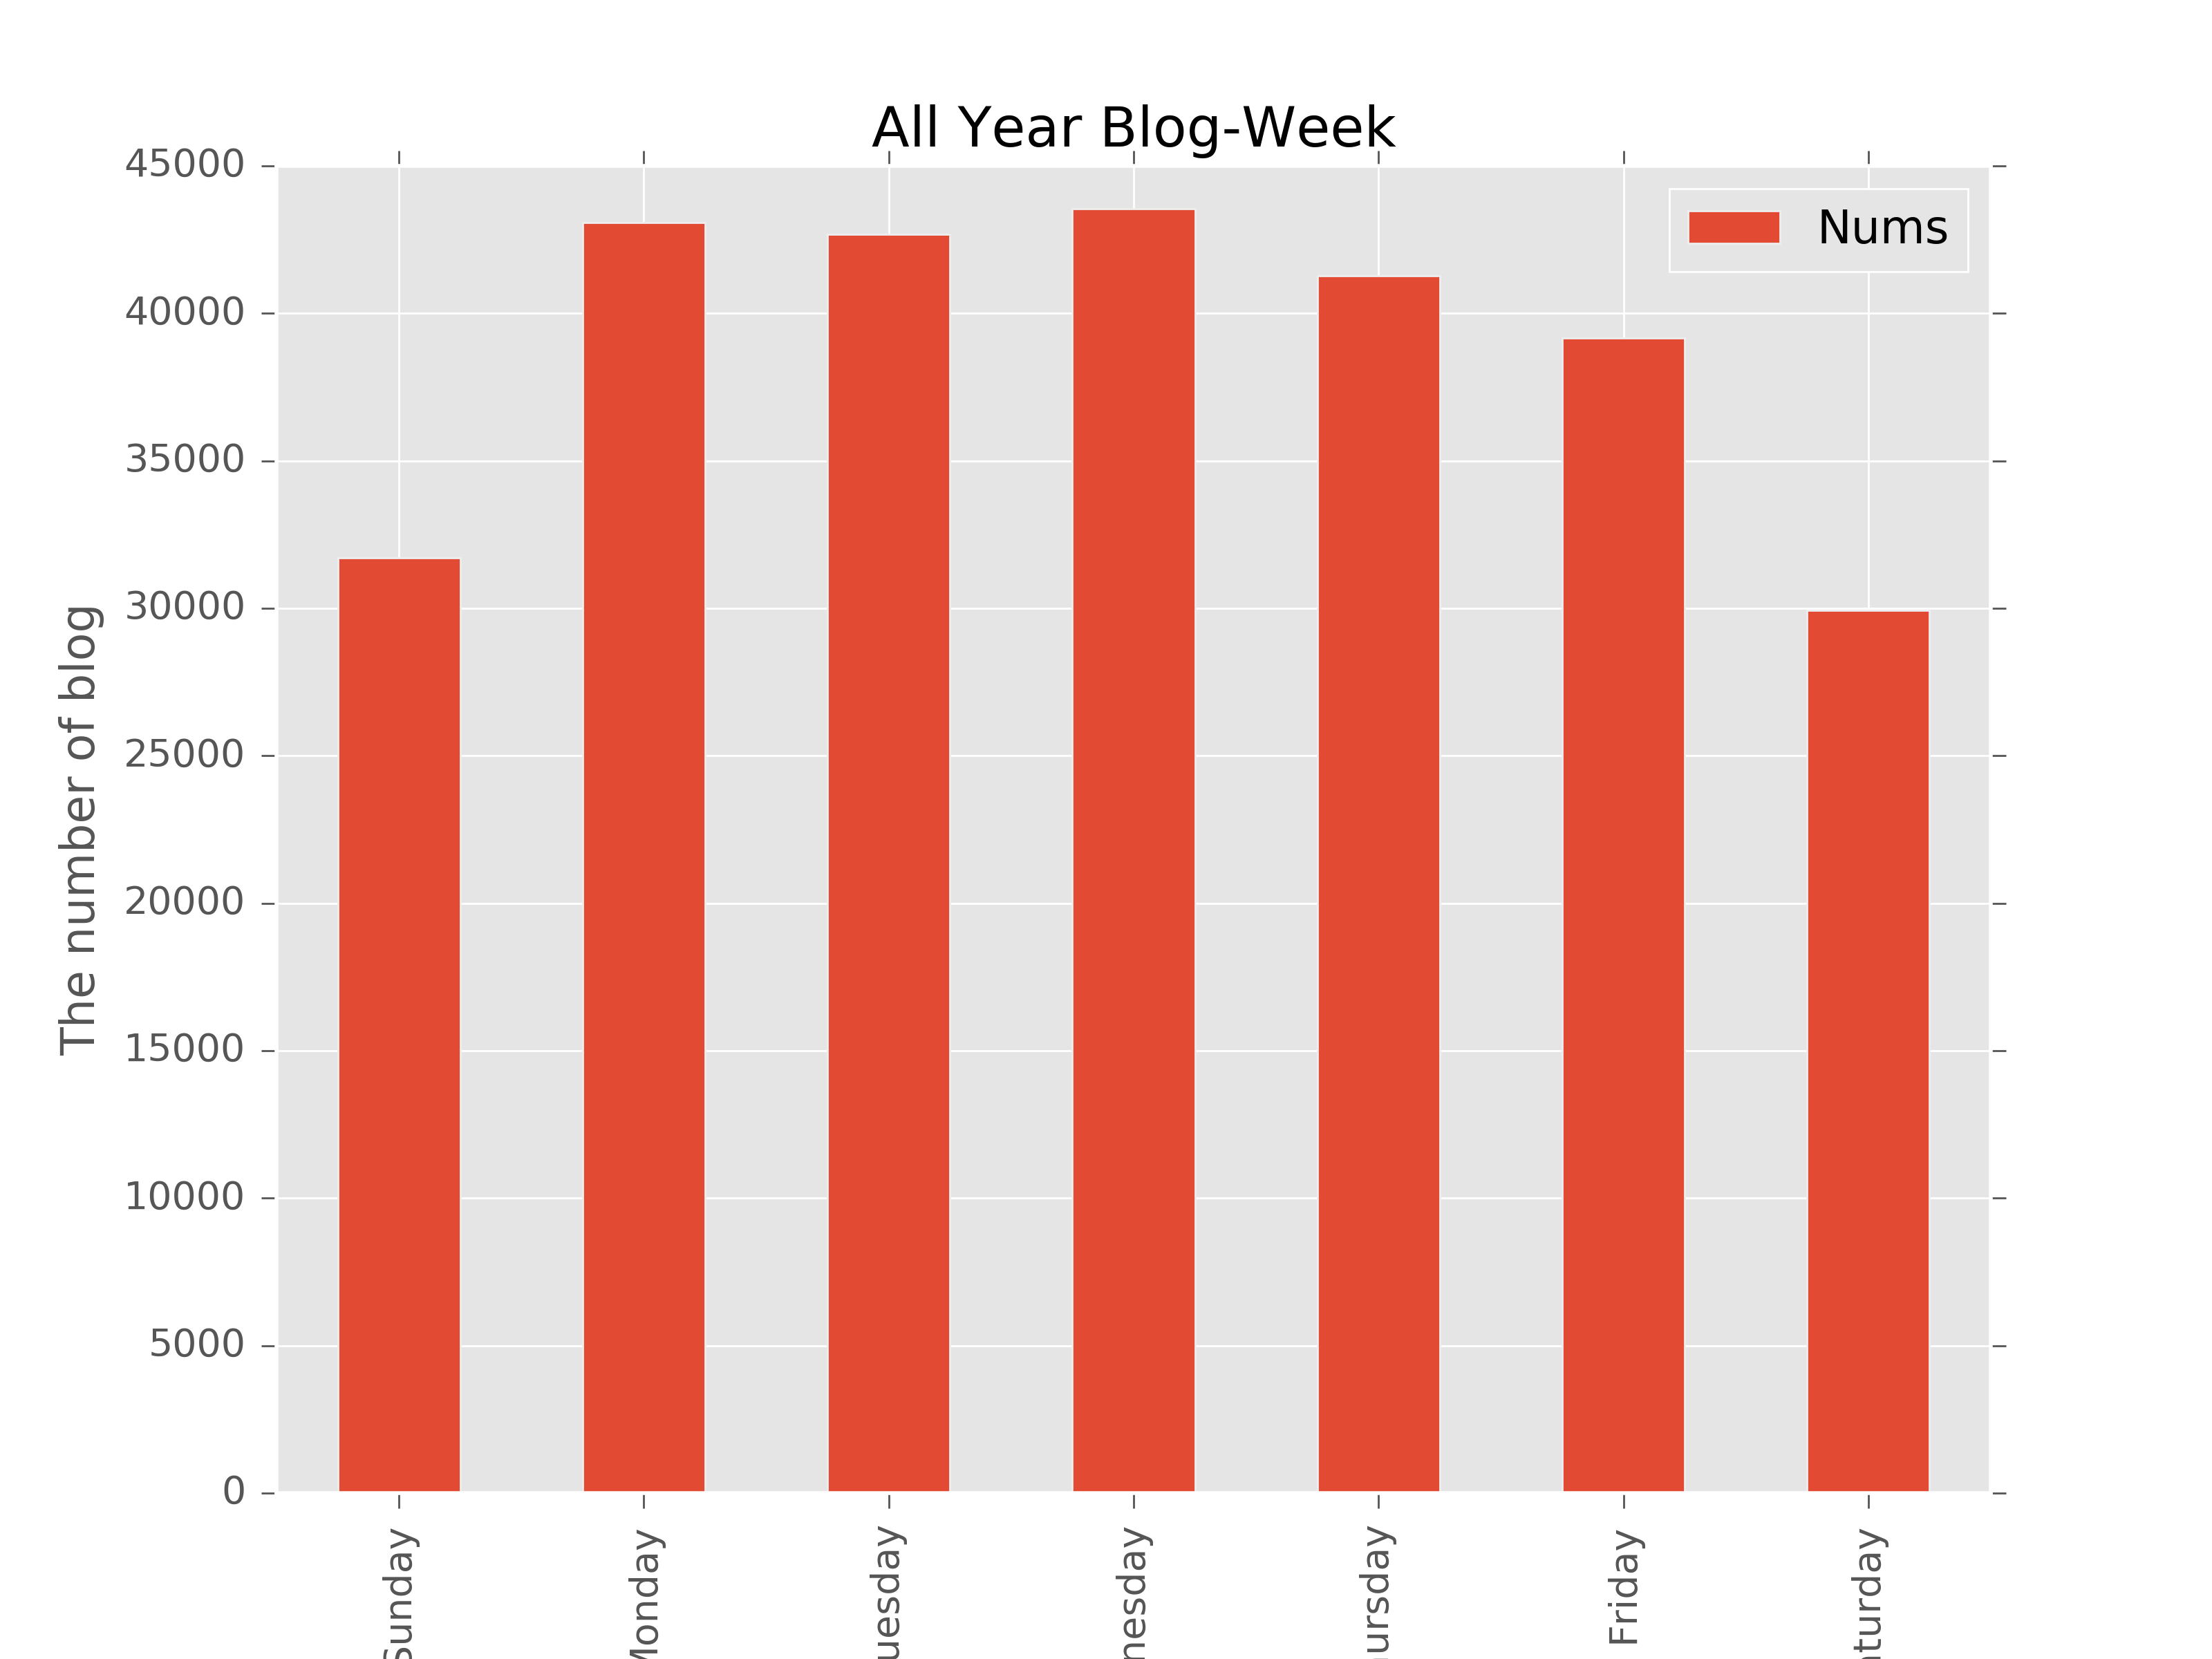
Python对应的代码如下,获取总的博客星期分布:
-
- ''
-
-
-
-
- import matplotlib.pyplot as plt
- import matplotlib
- import pandas as pd
- import numpy as np
- import MySQLdb
- from pandas import *
-
- try:
- conn = MySQLdb.connect(host='localhost',user='root',
- passwd='123456',port=3306, db='test01')
- cur = conn.cursor()
-
-
- conn.set_character_set('utf8')
- cur.execute('SET NAMES utf8;')
- cur.execute('SET CHARACTER SET utf8;')
- cur.execute('SET character_set_connection=utf8;')
- sql = ''
-
-
-
-
-
-
-
-
-
- cur.execute(sql)
- result = cur.fetchall()
- print result
-
- name = ['Sunday','Monday','Tuesday','Wednesday','Thursday','Friday','Saturday']
-
- data = np.array(result)
- print data
- d = data.T
- print d
-
- matplotlib.style.use('ggplot')
- df=DataFrame(d, index=name,columns=['Nums'])
- df.plot(kind='bar')
- plt.title('All Year Blog-Week')
- plt.xlabel('Week')
- plt.ylabel('The number of blog')
- plt.savefig('01csdn.png',dpi=400)
- plt.show()
-
-
- except MySQLdb.Error,e:
- print "Mysql Error %d: %s" % (e.args[0], e.args[1])
- finally:
- cur.close()
- conn.commit()
- conn.close()
-
运行结果如下所示:
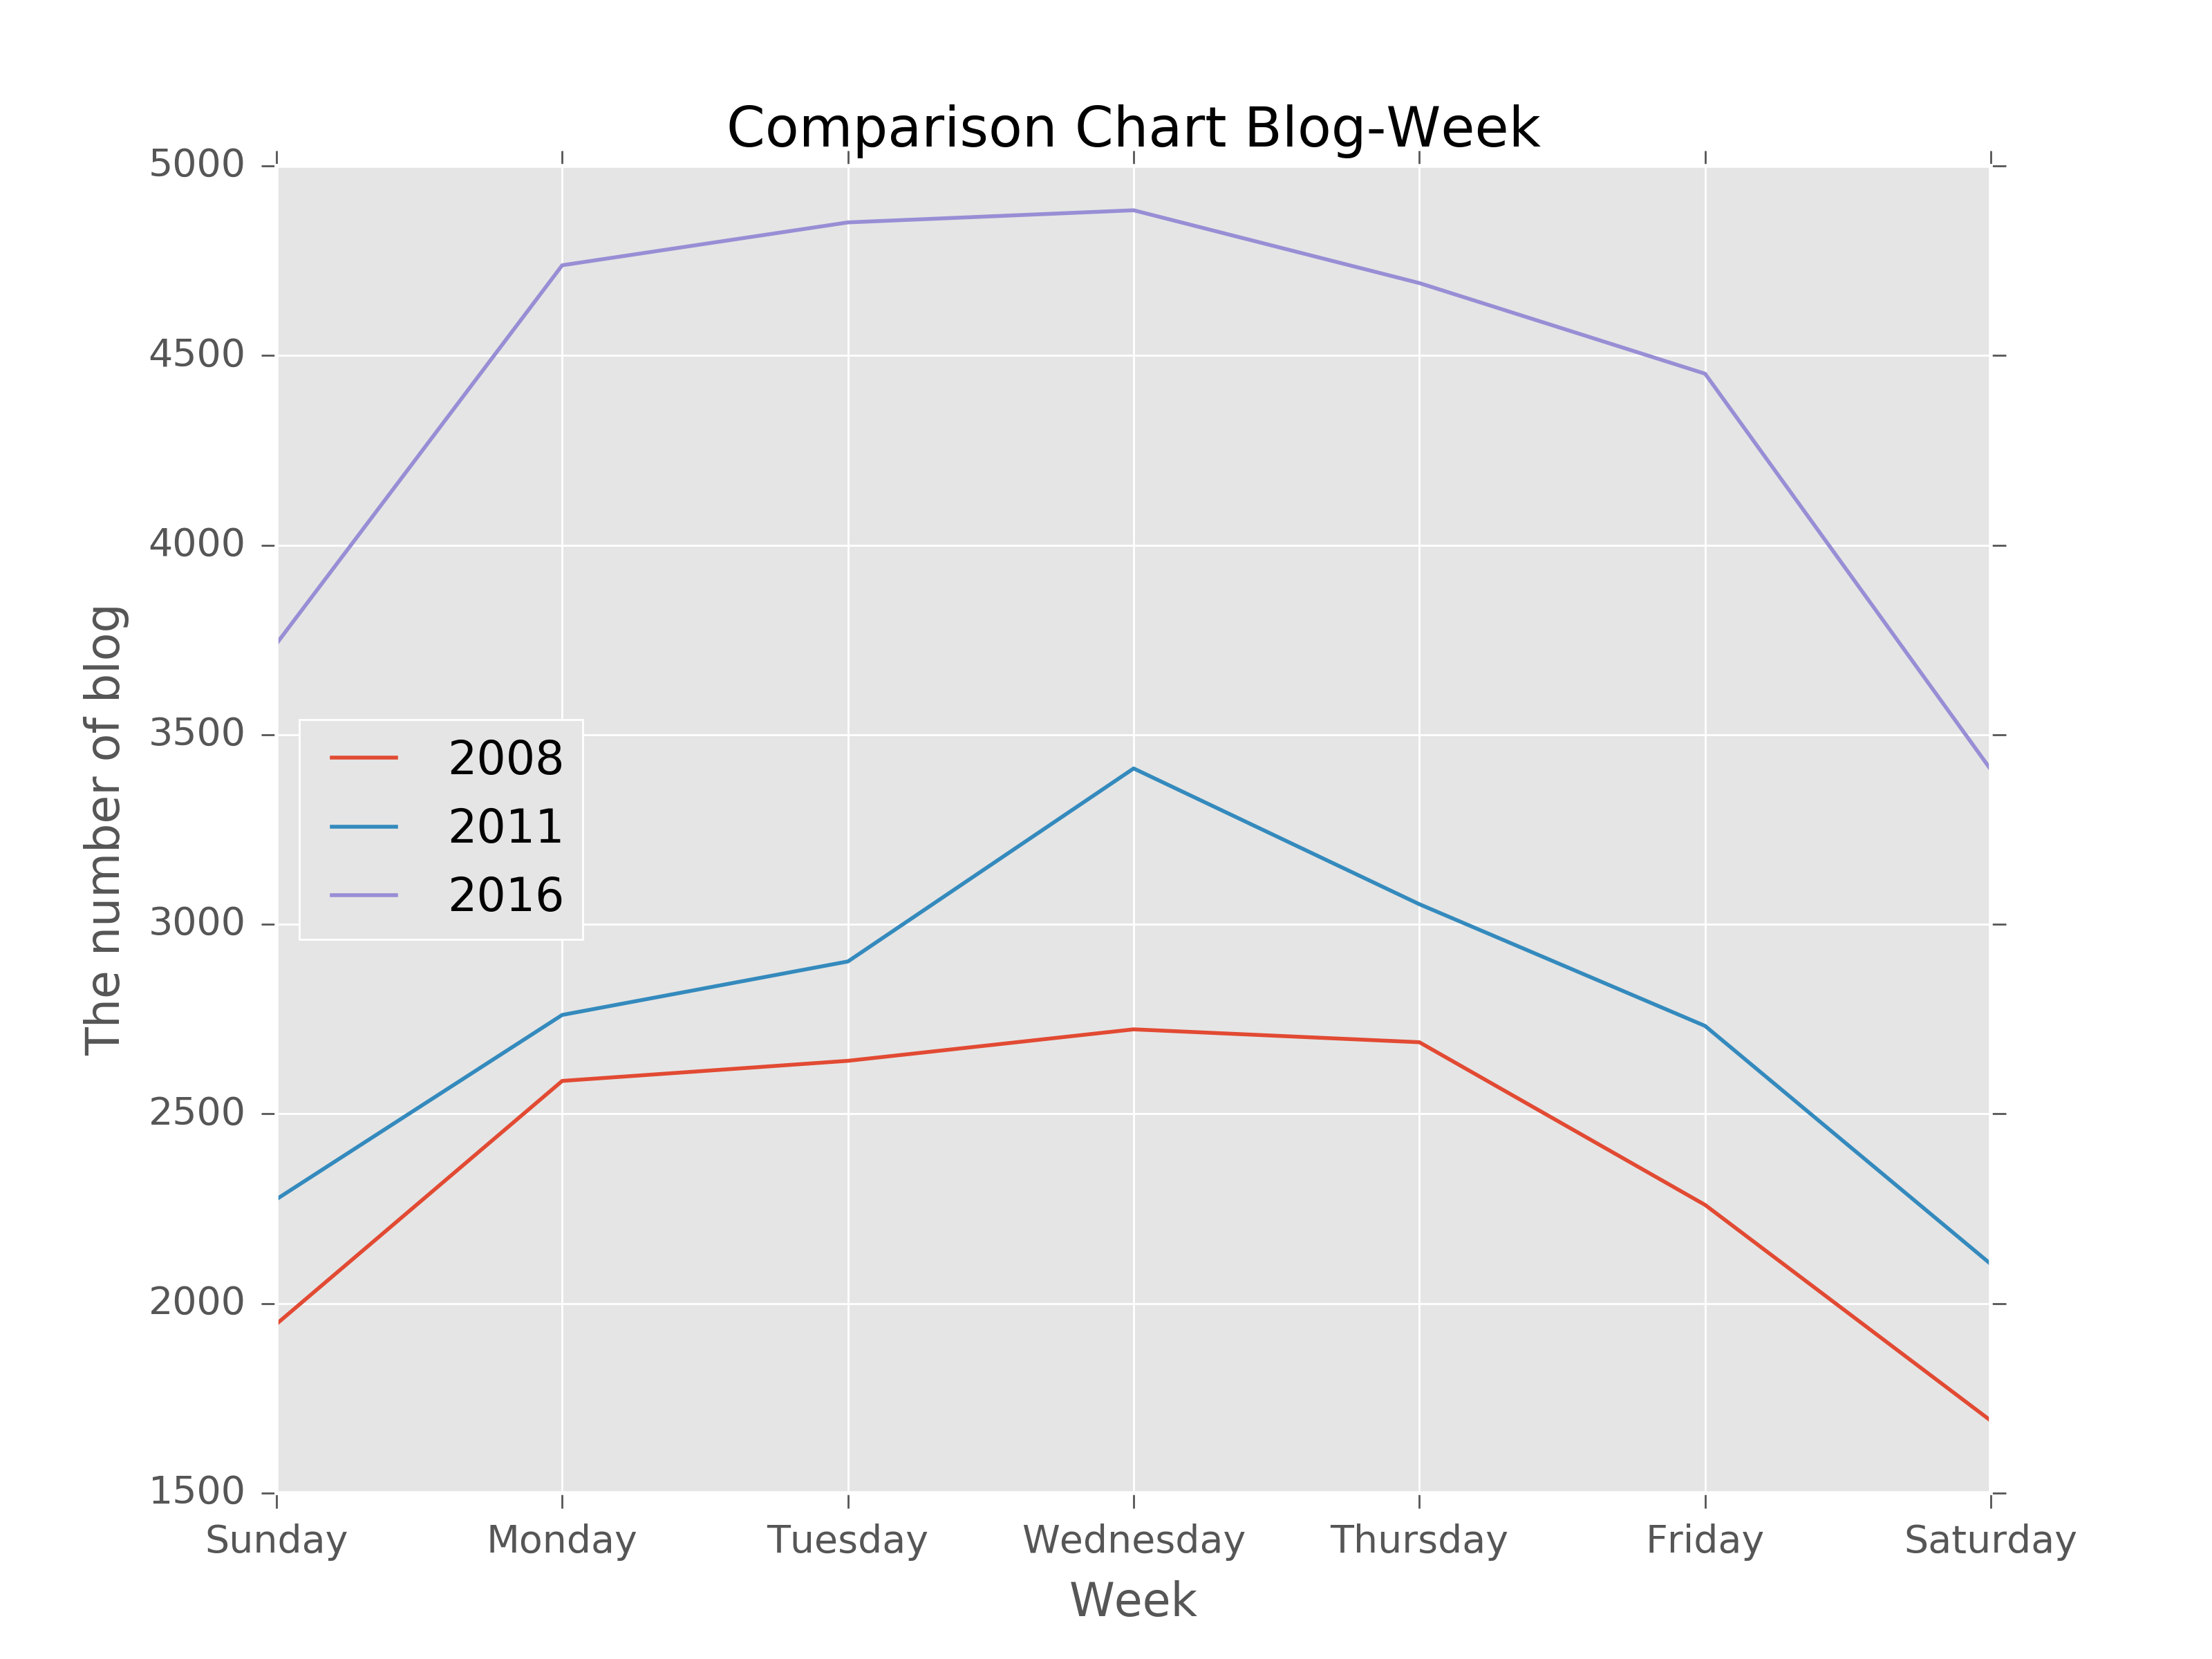
四. 星期数据柱状图及折线图对比
下面获取四年的数据进行对比,代码如下所示:
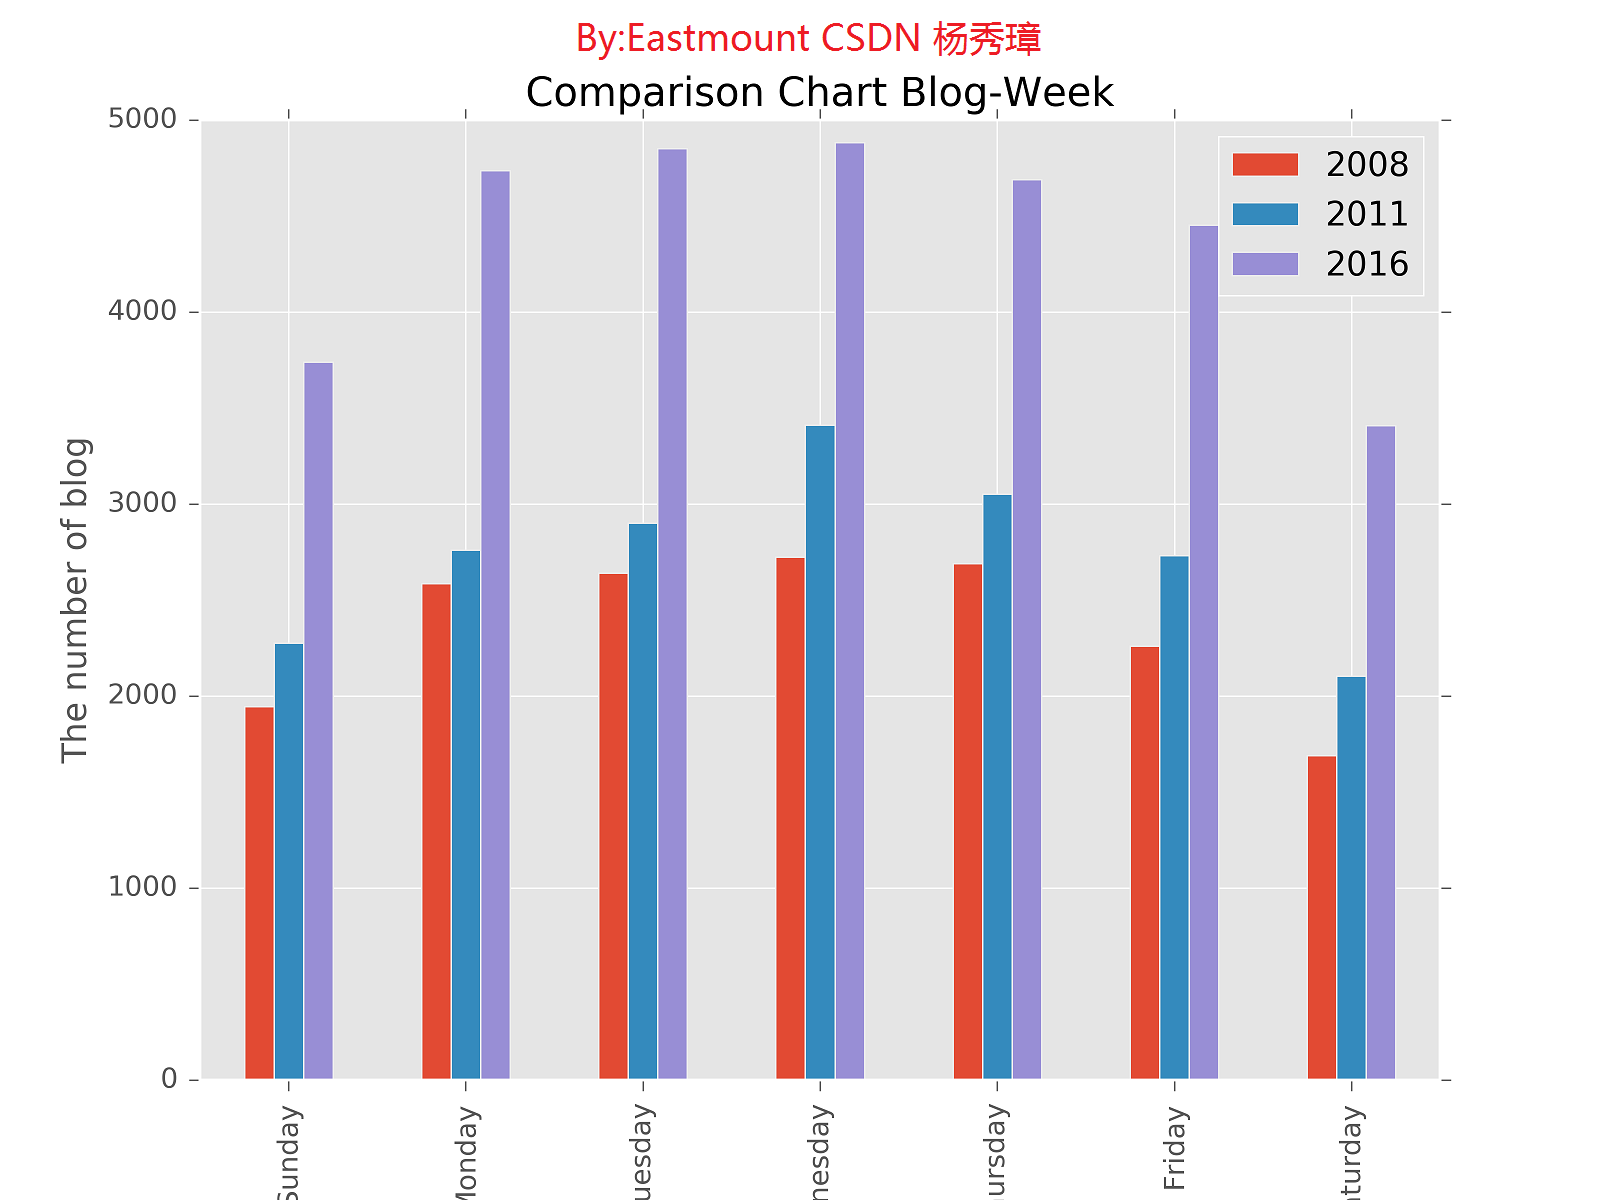
核心代码如下,注意三个一维数组转换为num[7][3]二维数组的方法。
data = np.random.rand(7,3)
print data
i = 0
while i<7:
data[i][0] = d1[i]
data[i][1] = d2[i]
data[i][2] = d3[i]
i = i + 1
matplotlib.style.use('ggplot')
#数据[7,3]数组 name为星期 columns对应年份
df=DataFrame(data, index=name, columns=['2008','2011','2016'])
df.plot(kind='bar')
plt.show()
完整代码为:
-
- ''
-
-
-
-
- import matplotlib.pyplot as plt
- import matplotlib
- import pandas as pd
- import numpy as np
- import MySQLdb
- from pandas import *
-
- try:
- conn = MySQLdb.connect(host='localhost',user='root',
- passwd='123456',port=3306, db='test01')
- cur = conn.cursor()
-
-
- conn.set_character_set('utf8')
- cur.execute('SET NAMES utf8;')
- cur.execute('SET CHARACTER SET utf8;')
- cur.execute('SET character_set_connection=utf8;')
- sql = ''
-
-
-
-
-
-
-
-
-
- cur.execute(sql)
- result1 = cur.fetchall()
- print result1
- name = ['Sunday','Monday','Tuesday','Wednesday','Thursday','Friday','Saturday']
- data = np.array(result1)
- d1 = data.T
- print d1
-
-
- sql = ''
-
-
-
-
-
-
-
-
-
- cur.execute(sql)
- result2 = cur.fetchall()
- data = np.array(result2)
- d2 = data.T
- print d2
-
-
- sql = ''
-
-
-
-
-
-
-
-
-
- cur.execute(sql)
- result3 = cur.fetchall()
- data = np.array(result3)
- print type(result3),type(data)
- d3 = data.T
- print d3
-
-
-
- data = np.random.rand(7,3)
- print data
- i = 0
- while i<7:
- data[i][0] = d1[i]
- data[i][1] = d2[i]
- data[i][2] = d3[i]
- i = i + 1
-
- print data
- print type(data)
-
-
- matplotlib.style.use('ggplot')
-
- df=DataFrame(data, index=name, columns=['2008','2011','2016'])
- df.plot(kind='bar')
- plt.title('Comparison Chart Blog-Week')
- plt.xlabel('Week')
- plt.ylabel('The number of blog')
- plt.savefig('03csdn.png', dpi=400)
- plt.show()
-
-
-
-
- except MySQLdb.Error,e:
- print "Mysql Error %d: %s" % (e.args[0], e.args[1])
- finally:
- cur.close()
- conn.commit()
- conn.close()
-
其中将代码 "df.plot(kind='bar')" 修改为 "df.plot()" 即为折线图。
讲到这里,通过Pandas、Matplotlib、Numpy结合MySQL可视化分析,并且进阶对比图片函数的分析过程已经讲完了,后面会结合SQL数据库做一些词云WordCloud、颜色图、Power-low图等分析。
希望文章对你有所帮助,尤其是结合数据库做数据分析的人。还是那句话,如果刚好需要这部分知识,你就会觉得非常有帮助,否则只是觉得好玩,这也是在线笔记的作用。如果文章中存在不足或错误的地方,还请海涵~
最近可能有些事情需要发生,我都需要平常心对待,真的好喜欢教学,认真教学生些东西,但是又觉得 "教优则 仕" 也有道理!做自己,为每一个自己的学生付出我所能做的所有。同时,真的心疼绿幺,但是有她陪着真的感觉两个人能克服一切,心安娜美~
可视化推荐下面的文章:
[转] 使用python绘制简单的图表 - 初雪之音 (强推)
利用Python进行数据分析——绘图和可视化(八) (强推)
用 Seaborn 画出好看的分布图(Python) [强推]
10分钟python图表绘制 | seaborn入门(一):distplot与kdeplot
python数据可视化(matplotlib,pandas绘图,散点图,柱状图,折线图,箱线图)
Python之numpy教程(三):转置、乘积、通用函数
(By:Eastmount 2017-03-20 晚上7点 http://blog.csdn.net/eastmount/ )


 1万+
1万+

 被折叠的 条评论
为什么被折叠?
被折叠的 条评论
为什么被折叠?
 到【灌水乐园】发言


