


代码
LineChart类
package test.xl.com.myrealtimechart.demo1;

import java.nio.ByteBuffer;
import java.nio.ByteOrder;
import java.nio.FloatBuffer;

import javax.microedition.khronos.opengles.GL10;

/**
 * Created by xl on 2018/7/18.
 */
public class LineChart {

    //缓冲区长度,点数
    public final static int BUFFER_SIZE = 500;
    //缓冲区数组
    private float[] mChartDatas = new float[BUFFER_SIZE];
    //缓冲区缓存
    private FloatBuffer vertexBuffer;
    //顶点坐标数组
    private float[] vertices = new float[BUFFER_SIZE * 3];
    //绘图区域
    private int width, height;

    public LineChart() {
    }

    /**
     * 根据缓冲区数组 封装 顶点坐标数组
     */
    private void drawRealtimeChart() {
        //坐标系xyz,屏幕中心为原点坐标(0,0,0),左上角为(-1,1,0),右下角(1,-1,0),坐标值有问题?好窄
        float span = 20.0f / BUFFER_SIZE;
        //vertices的0,3,6……位置放x坐标值
        for (int i = 0; i < BUFFER_SIZE; i++) {
            vertices[i * 3] = -10 + i * span;
        }
        //vertices的1,4,7……位置放y坐标值
        for (int i = 0; i < BUFFER_SIZE; i++) {
            vertices[i * 3 + 1] = mChartDatas[i];
        }
        //vertices的2,5,8……位置放z坐标值,平面图,默认为0
        for (int i = 0; i < BUFFER_SIZE; i++) {
            vertices[i * 3 + 2] = 0.0f;
        }
    }

    /**
     * 开辟对应的缓冲区存放顶点坐标数组
     */
    private void vertexGenerate() {
        //一个浮点数在内存中占4个字节,在内存中开辟指定长度的缓冲区,用来存放顶点坐标数组
        ByteBuffer vertexByteBuffer = ByteBuffer.allocateDirect(vertices.length * 4);
        //设置字节处理规则,大端模式或者小端模式,设置为默认
        vertexByteBuffer.order(ByteOrder.nativeOrder());
        //将内存中分配的字节缓冲区转换成浮点数缓冲区
        vertexBuffer = vertexByteBuffer.asFloatBuffer();
        //存放顶点坐标数组
        vertexBuffer.put(vertices);
        //复位缓冲区,position指向0,第一个数据
        vertexBuffer.position(0);
    }

    public void setResolution(int width, int height) {
        this.width = width;
        this.height = height;
    }

    public void setChartData(float[] chartData) {
        this.mChartDatas = chartData;
        drawRealtimeChart();
        vertexGenerate();
    }

    public void draw(GL10 gl) {
        //Log.d("Chart Ratio3 "," width " +width + " H " + height); 绘图区域,设置画面的大小
        //gl.glViewport(0, 0, width, height);
        // bind the previously generated texture 顶点绘图
        gl.glEnableClientState(GL10.GL_VERTEX_ARRAY);
        // set the color for the triangle 设置绘图颜色
        gl.glColor4f(0.0f, 1.0f, 0.0f, 0.7f);
        // Point to our vertex buffer 设置顶点数据,3代表XYZ坐标系
        gl.glVertexPointer(3, GL10.GL_FLOAT, 0, vertexBuffer);
        // Line width
        gl.glLineWidth(3.0f);
        // Draw the vertices as triangle strip,顶点之间的连接模式
        gl.glDrawArrays(GL10.GL_LINE_STRIP, 0, vertices.length / 3);
        //Disable the client state before leaving 关闭顶点设置
        gl.glDisableClientState(GL10.GL_VERTEX_ARRAY);
    }
}
Renderer类
package test.xl.com.myrealtimechart.demo1;

import android.content.Context;
import android.opengl.GLSurfaceView;
import android.opengl.GLU;

import javax.microedition.khronos.egl.EGLConfig;
import javax.microedition.khronos.opengles.GL10;

/**
 * Created by xl on 2018/7/18.
 */
public class ChartRenderer implements GLSurfaceView.Renderer {

    volatile float[] chartData = new float[LineChart.BUFFER_SIZE];
    private int width;
    private int height;
    private Context context;
    private LineChart lineChart;

    public ChartRenderer(Context context) {
        this.context = context;
        lineChart = new LineChart();
    }

    @Override
    public void onSurfaceCreated(GL10 gl10, EGLConfig eglConfig) {
        //lineChart = new LineChart();
    }

    @Override
    public void onSurfaceChanged(GL10 gl, int width, int height) {
        this.width = width;
        this.height = height;
        //Prevent a divide by 0 by making height =1
        if (height == 0) {
            height = 1;
        }
        //Reset current viewport
        gl.glViewport(0, 0, width, height);
        //Select Projection Matrix
        gl.glMatrixMode(GL10.GL_PROJECTION);
        //Reset Projection Matrix
        gl.glLoadIdentity();
        //Calculate The Aspect Ratio Of The Window
        //Log.d("Chart Ratio2 "," width " +width + " H " + height);
        //void gluPerspective (GLdouble fovy, GLdouble aspect, GLdouble zNear, GLdouble zFar)
        //fovy是眼睛上下睁开的幅度,角度值,值越小,视野范围越狭小(眯眼),值越大,视野范围越宽阔(睁开铜铃般的大眼);
        //zNear表示近裁剪面到眼睛的距离,zFar表示远裁剪面到眼睛的距离,注意zNear和zFar不能设置设置为负值(你怎么看到眼睛后面的东西)。
        //aspect表示裁剪面的宽w高h比,这个影响到视野的截面有多大。
        GLU.gluPerspective(gl, 100.0f, (float) height * 2.0f / (float) width, 0.1f, 100.0f);
        gl.glMatrixMode(GL10.GL_MODELVIEW);     //Select The Modelview Matrix
        gl.glLoadIdentity();                    //Reset The Modelview Matrix
    }

    @Override
    public void onDrawFrame(GL10 gl) {
        // clear Screen and Depth Buffer
        gl.glClear(GL10.GL_COLOR_BUFFER_BIT | GL10.GL_DEPTH_BUFFER_BIT);
        // Reset the Modelview Matrix
        gl.glLoadIdentity();
        //Move 5 units into the screen is the same as moving the camera 5 units away
        gl.glTranslatef(0.0f, 0.0f, -3.0f);
        this.lineChart.setResolution(width, height);
        this.lineChart.setChartData(chartData);
        lineChart.draw(gl);
    }
}
GLSurfaceView类
package test.xl.com.myrealtimechart.demo1;

import android.content.Context;
import android.graphics.PixelFormat;
import android.opengl.GLSurfaceView;

/**
 * Created by xl on 2018/7/18.
 */
public class ChartSurfaceView extends GLSurfaceView {

    //线程标志位
    private boolean isUpdating = false;
    //渲染Renderer
    private ChartRenderer mRenderer;
    //y坐标数组
    private float[] datapoints = new float[LineChart.BUFFER_SIZE];

    public ChartSurfaceView(Context context) {
        super(context);
        //设置EGL配置选择
        setEGLConfigChooser(8, 8, 8, 8, 16, 0);
        //设置处于屏幕最前边
        this.setZOrderOnTop(true); //necessary
        getHolder().setFormat(PixelFormat.TRANSLUCENT);
        // Set the Renderer for drawing on the GLSurfaceView
        mRenderer = new ChartRenderer(context);
        setRenderer(mRenderer);
        //初始化
        for (int i = 0; i < datapoints.length; i++) {
            datapoints[i] = 0;
        }
        setChartData(datapoints);
        // Render the view only when there is a change in the drawing data,有变化时绘制
        setRenderMode(GLSurfaceView.RENDERMODE_WHEN_DIRTY);
        new Thread(new Task()).start();
    }

    /**
     * 设置数据源
     * @param datapoints
     */
    public void setChartData(float[] datapoints) {
        if (datapoints != null && datapoints.length > 0) {
            isUpdating = true;
            this.datapoints = datapoints.clone();
            float gMaxValue = getMax(datapoints);
            float gMinValue = getMin(datapoints);
            for (int i = 0; i < this.datapoints.length; i++) {
                this.datapoints[i] = (((datapoints[i] - gMinValue) * (1.0f - (-1.0f)) / (gMaxValue - gMinValue)) + (-1));
            }
            isUpdating = false;
        } else {

        }
    }


    /**
     * 获取数组最大值
     * @param array
     * @return
     */
    private float getMax(float[] array) {
        if(array != null && array.length > 0){
            float max = array[0];
            for (int i = 1; i < array.length; i++) {
                if (array[i] > max) {
                    max = array[i];
                }
            }
            return max;
        } else {
            return 0f;
        }
    }

    /**
     * 获取数组最小值
     * @param array
     * @return
     */
    private float getMin(float[] array) {
        if(array != null && array.length > 0){
            float min = array[0];
            for (int i = 1; i < array.length; i++) {
                if (array[i] < min) {
                    min = array[i];
                }
            }
            return min;
        } else {
            return 0f;
        }
    }

    class Task implements Runnable {
        @Override
        public void run() {
            while (true) {
                if (!isUpdating) {
                    mRenderer.chartData = datapoints;
                    requestRender();
                }
                try {
                    Thread.sleep(30);
                } catch (InterruptedException e) {
                    e.printStackTrace();
                }
            }
        }
    }

}
布局文件xml
<?xml version="1.0" encoding="utf-8"?>
<LinearLayout xmlns:android="http://schemas.android.com/apk/res/android"
    android:id="@+id/LinearLayout1"
    android:layout_width="match_parent"
    android:layout_height="match_parent"
    android:orientation="vertical">

    <Button
        android:id="@+id/btn"
        android:layout_width="match_parent"
        android:layout_height="wrap_content"
        android:text="OK" />

    <LinearLayout
        android:id="@+id/chartView"
        android:layout_width="match_parent"
        android:layout_height="match_parent"
        android:orientation="horizontal"></LinearLayout>

</LinearLayout>
清单文件xml
<?xml version="1.0" encoding="utf-8"?>
<manifest xmlns:android="http://schemas.android.com/apk/res/android"
    package="test.xl.com.myrealtimechart">

    <application
        android:allowBackup="true"
        android:icon="@mipmap/ic_launcher"
        android:label="@string/app_name"
        android:supportsRtl="true"
        android:theme="@style/AppTheme">
        <activity android:name=".MainActivity">
            <intent-filter>
                <action android:name="android.intent.action.MAIN" />

                <category android:name="android.intent.category.LAUNCHER" />
            </intent-filter>
        </activity>

        <activity android:name="test.xl.com.myrealtimechart.demo1.Demo1Activity"
            android:screenOrientation="portrait">
        </activity>

        <activity android:name="test.xl.com.myrealtimechart.demo2.TriangleActivity"
            android:screenOrientation="portrait">
        </activity>
    </application>

</manifest>
Activity
package test.xl.com.myrealtimechart.demo1;

import android.content.Intent;
import android.os.Bundle;
import android.os.Handler;
import android.support.annotation.Nullable;
import android.support.v7.app.AppCompatActivity;
import android.util.DisplayMetrics;
import android.view.View;
import android.view.ViewGroup;
import android.widget.Button;
import android.widget.LinearLayout;

import test.xl.com.myrealtimechart.R;
import test.xl.com.myrealtimechart.demo2.TriangleActivity;

/**
 * Created by xl on 2018/7/18.
 */
public class Demo1Activity extends AppCompatActivity {

    private Handler handler = new Handler();
    private ChartSurfaceView glChart;
    private boolean bThreadEnding = false;

    @Override
    protected void onCreate(@Nullable Bundle savedInstanceState) {
        super.onCreate(savedInstanceState);
        setContentView(R.layout.activity_main);
        Button btn = (Button) findViewById(R.id.btn);
        btn.setOnClickListener(new View.OnClickListener() {
            @Override
            public void onClick(View view) {
                enter();
            }
        });
        LinearLayout glChartContainer = (LinearLayout) findViewById(R.id.chartView);
        glChart = new ChartSurfaceView(this);
        ViewGroup.LayoutParams lp = new ViewGroup.LayoutParams(LinearLayout.LayoutParams.MATCH_PARENT, LinearLayout.LayoutParams.MATCH_PARENT);
        DisplayMetrics dm = getResources().getDisplayMetrics();
        lp.width = dm.widthPixels;
        lp.height = dm.heightPixels;
        glChartContainer.addView(glChart, lp);
        //glChartContainer.addView(glChart, new ViewGroup.LayoutParams(ViewGroup.LayoutParams.MATCH_PARENT, ViewGroup.LayoutParams.MATCH_PARENT));
        glChartContainer.setVisibility(View.VISIBLE);
        //Set the schedule function and rate
        updateTimerThread.run();
        //new Thread(updateTimerThread).start();
    }

    private Runnable updateTimerThread = new Runnable() {
        public void run() {
            try {
                Thread.sleep(30);
            } catch (InterruptedException e) {
                e.printStackTrace();
            }
            float[] f1 = new float[LineChart.BUFFER_SIZE];
            for (int i = 0; i < f1.length; i++) {
                f1[i] = (float) (-1f + Math.random() * 2);
            }
            glChart.setChartData(f1);
            handler.postDelayed(this, 0);
        }
    };

    @Override
    protected void onPause() {
        super.onPause();
        if (glChart != null) {
            glChart.onPause();
        }
    }

    @Override
    protected void onResume() {
        super.onResume();
        if (glChart != null) {
            glChart.onResume();
        }
    }

    @Override
    protected void onDestroy() {
        super.onDestroy();
        bThreadEnding = true;
    }

    /**
     * 跳转
     */
    private void enter(){
        Intent intent = new Intent(this, TriangleActivity.class);
        startActivity(intent);
    }
}
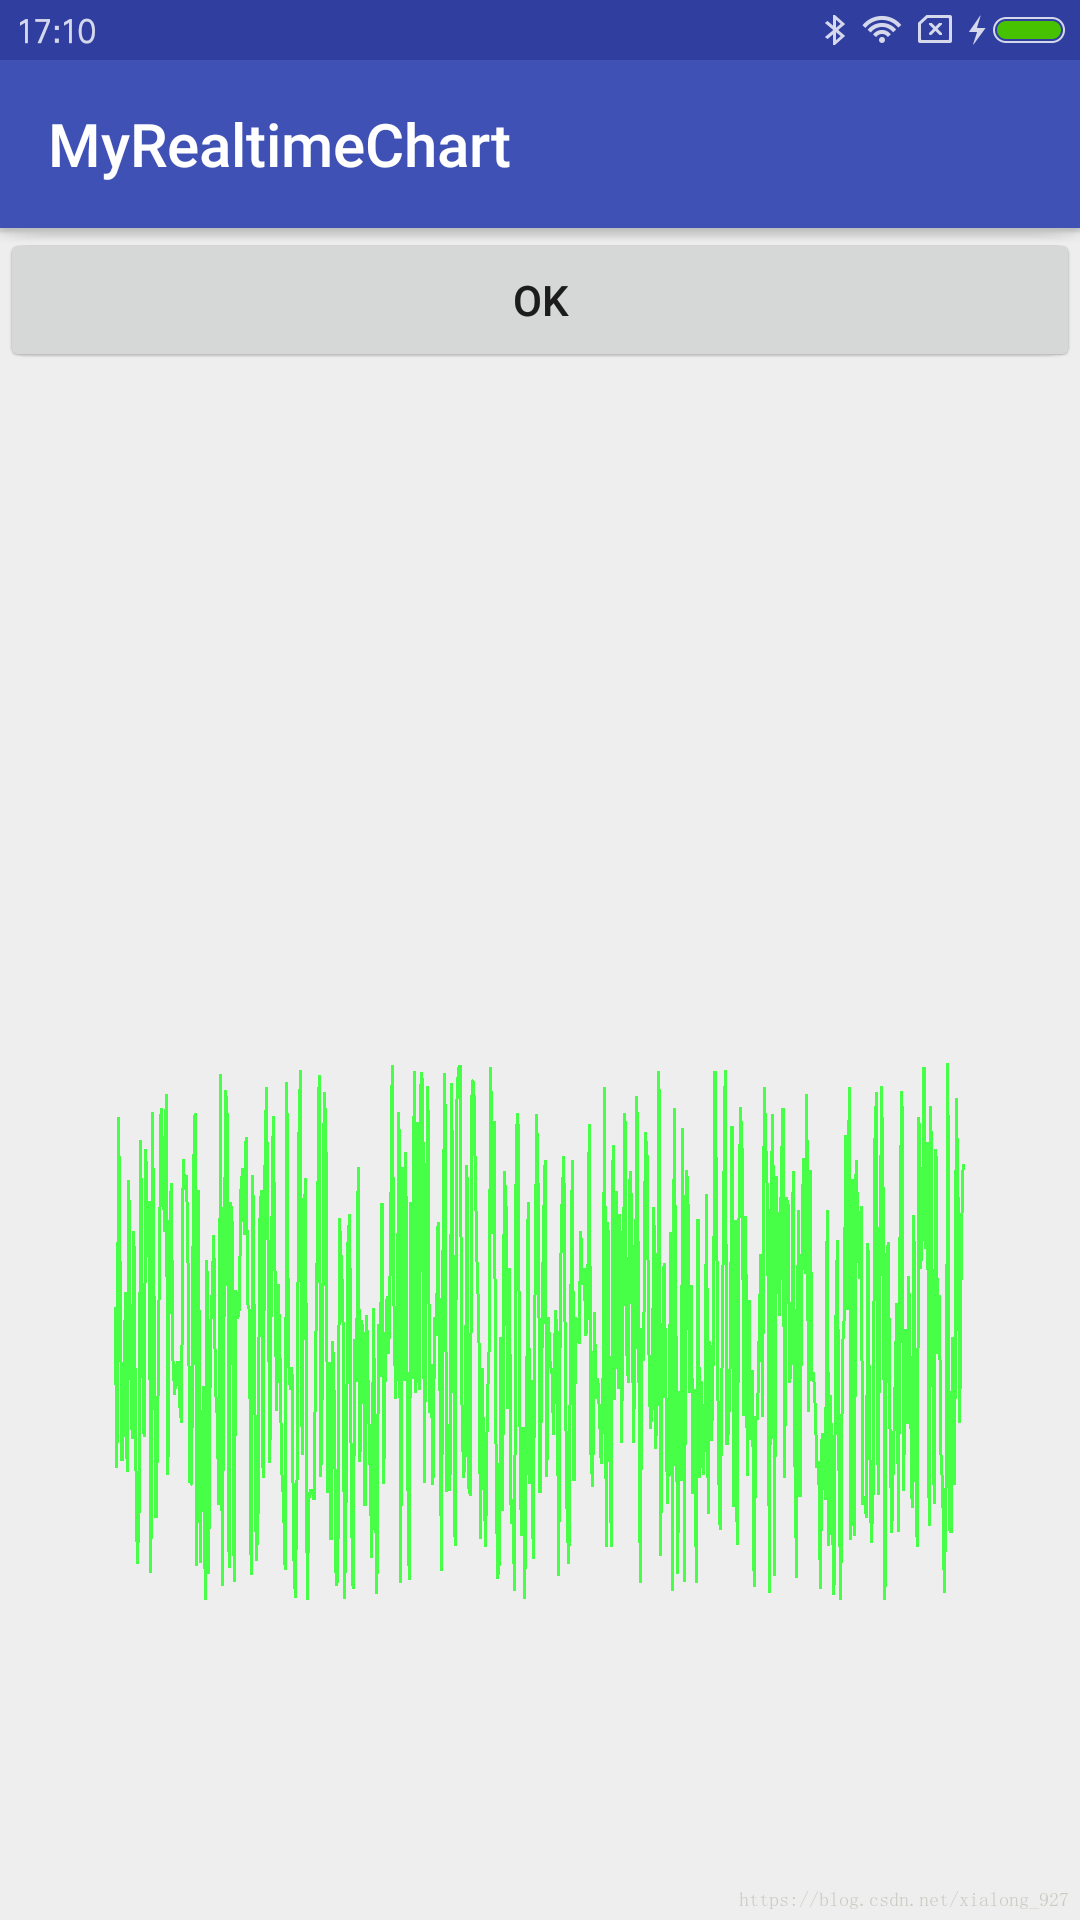
注:采用以下坐标出现了问题,不清楚为什么?x,y轴范围-1到1,但是测试结果没有布满整个屏幕。

如图:


 631
631


 被折叠的 条评论
为什么被折叠?
被折叠的 条评论
为什么被折叠?
 到【灌水乐园】发言


