import cv2
import numpy as np
from matplotlib import pyplot as plt
%matplotlib inline
Step1. Get Dark Channel
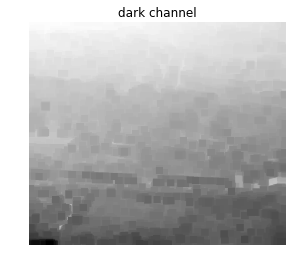
- 求出每个像素RGB分量中的最小值,存入一副和原始图像大小相同的灰度图中;
- 灰度图进行最小值滤波,滤波的半径由窗口大小决定,一般有WindowSize = 2 * Radius + 1;
 def get_dark_channel(image):
    patchSize = 15
    padSize = 7
    height, width, channel = image.shape
    jDark = np.zeros((height, width))

    for j in range(height):
        for i in range(width):
            tmp = []
            for c in range(channel):
                tmp.append(image[j, i, c])
            jDark[j, i] = min(tmp)

    img = np.pad(jDark, ((padSize, padSize), (padSize, padSize)), mode='constant', constant_values=(255))
    for r in range(height):
        for c in range(width):
            patch = img[r: (r + patchSize - 1), c: (c + patchSize - 1)]
            jDark[r, c] = patch.min()

    return jDark
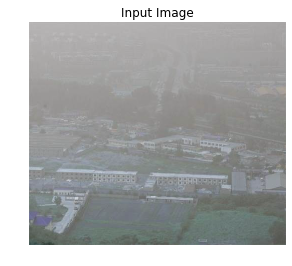
Show the dark channel
image = cv2.imread('1.jpg')
dark_image = get_dark_channel(image)

plt.figure(1)
plt.axis('off')
plt.title("Input Image")
plt.imshow(image)

plt.figure(2)
plt.axis('off')
plt.title("dark channel")
plt.imshow(dark_image, cmap=plt.cm.gray)
<matplotlib.image.AxesImage at 0x7f653ad7f810>
cv2.imshow('test', image)Step2. Estimate atmospheric light
- 从暗通道图中按照亮度的大小取前0.1%的像素
- 在这些位置中,在原始有雾图像I中寻找对应的具有最高亮度(or average)的点的值,作为A值
def estimate_atmospheric_light(image, jDark):
    height, width, channel = image.shape
    # 0.1%
    numpx = max(width * height / 1000, 1)
    jDarkVec = np.reshape(jDark, (width * height))
    imgVec = np.reshape(image, (width * height, channel))
    indices = np.argsort(jDarkVec)
    brightest_indices = indices[width * height - numpx:]

#     atmMax = np.zeros(channel)
#     atmMax = imgVec[brightest_indices[-1]]
#     A = atmMax
    atmSum = np.zeros(channel)
    for i in xrange(numpx):
        atmSum = atmSum + imgVec[brightest_indices[i]]
    A = atmSum / numpx
    return A
Print the atmospheric light
A = estimate_atmospheric_light(image, dark_image)
print A
[ 181.84482759 179.84482759 179.84482759]
Step3. Estimate transmission
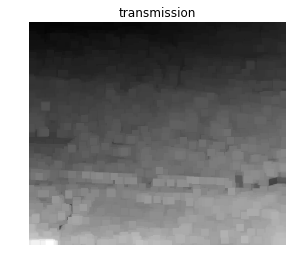
- 透射率的预估值
def estimate_transmission(image, A):
    omega = 0.95
    height, width, channel = image.shape
    img = np.zeros((height, width, channel))
    for c in range(channel):
        img[:, :, c] = image[:, :, c] / float(A[c])
    transmission = 1 - omega * get_dark_channel(img)
    return transmission
Show the transmission
transmission = estimate_transmission(image, A)
plt.figure(1)
plt.axis('off')
plt.title("transmission")
plt.imshow(transmission, cmap=plt.cm.gray)
<matplotlib.image.AxesImage at 0x7f653b041c10>
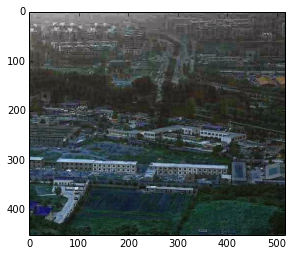
Step4. Dehaze
def dehaze(image, A, transmission):
    t0 = 0.1
    height, width, channel = image.shape
    J = np.zeros((height, width, channel))
    for c in range(channel):
        J[:, :, c] = A[c] + (image[:, :, c] - A[c])/np.maximum(transmission, t0)

    return J
Show the dehaze image
dehaze_image = dehaze(image, A, transmission)
cv2.imwrite('out.jpg', dehaze_image)
dehaze_image = dehaze_image / np.amax(dehaze_image)
plt.imshow(dehaze_image)
<matplotlib.image.AxesImage at 0x7f653b0c5390>
Step5. Guided filter
- guidance image: I
- filtering input image: p
- local window radius: r
- regularization parameter: epsilon
import numpy.matlib

def boxfilter(image, r):
    height, width = image.shape[:2]
    dstImage = np.zeros((height, width))

    cumImage = np.cumsum(image, axis = 0)
    dstImage[0: r + 1, :] = cumImage[r: 2 * r + 1, :]
    dstImage[r + 1: height - r, :] = cumImage[2 * r + 1: height, :] - cumImage[0: height - 2 * r - 1, :]
    dstImage[height - r: height, :] =\
    np.matlib.repmat(cumImage[height - 1, :], r, 1) - cumImage[height - 2 * r - 1: height - r - 1, :]

    cumImage = np.cumsum(dstImage, axis = 1)
    dstImage[:, 0: r + 1] = cumImage[:, r: 2 * r + 1]
    dstImage[:, r + 1: width - r] = cumImage[:, 2 * r + 1: width] - cumImage[:, 0: width - 2 * r - 1]
    dstImage[:, width - r:width] =\
    np.matlib.repmat(np.matrix(cumImage[:, width - 1]).T, 1, r) - cumImage[:, width - 2 * r - 1: width - r - 1]

    return dstImage
def guide_filter(I, p, r, eps):
height, width = I.shape[:2]
N = boxfilter(np.ones((height, width)), r)
mean_I = boxfilter(I, r) / N
mean_p = boxfilter(p, r) / N
corr_II = boxfilter(I * I, r) / N
corr_Ip = boxfilter(I * p, r) / N
var_I = corr_II - mean_I * mean_I
cov_Ip = corr_Ip - mean_I * mean_p
a = cov_Ip / (var_I + eps)
b = mean_p - a * mean_I
mean_a = boxfilter(a, r) / N
mean_b = boxfilter(b, r) / N
q = mean_a * I + mean_b
return qShow the refine transmission
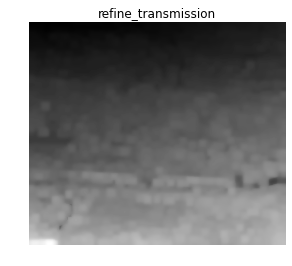
refine_transmission = guide_filter(transmission, transmission, 3, 0.01)

plt.figure(1)
plt.axis('off')
plt.title("refine_transmission")
plt.imshow(refine_transmission, cmap=plt.cm.gray)
<matplotlib.image.AxesImage at 0x7f653af7cc10>
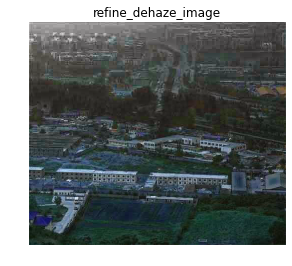
Show the result difference between transmission and refine transmission
refine_dehaze_image = dehaze(image, A, refine_transmission)
cv2.imwrite('refine_out.jpg', refine_dehaze_image)
refine_dehaze_image = refine_dehaze_image / np.amax(refine_dehaze_image)

plt.figure(1)
plt.axis('off')
plt.title("dehaze_image")
plt.imshow(dehaze_image)

plt.figure(2)
plt.axis('off')
plt.title("refine_dehaze_image")
plt.imshow(refine_dehaze_image)
<matplotlib.image.AxesImage at 0x7f65341c96d0>
Another issue:Reimplement of Investigating Haze-Relevant Features in a Learning Framework for Image Dehazing(CVPR 2014)




 2320
2320

 被折叠的 条评论
为什么被折叠?


