


 本文探讨了Oracle数据库中OPTIMIZER_INDEX_COST_ADJ参数的影响,通过实验展示了参数值如何改变查询优化器的选择,使查询更倾向于索引扫描或全表扫描。
参考文档:
https://docs.oracle.com/cd/E11882_01/server.112/e40402/initparams170.htm#REFRN10143
https://docs.oracle.com/en/database/oracle/oracle-database/12.2/tgsql/influencing-the-optimizer.html#GUID-C1C85DEA-3583-40FE-B5BB-6AC8F76FFE34
-- 创建测试用的表
create table t as select * from dba_objects;
select * from t where object_id >60000;
create index idx_t on t (object_id);
1 测试,将该参数调整为较小的值,比如调整为30
-- 会话1中
set autotrace traceonly
select * from t where object_id >60000;
--会话2 中
alter session set optimizer_index_cost_adj =30;
set autotrace traceonly
select * from t where object_id >60000;
-- 会话1的执行计划
SYS@test>select * from t where object_id >60000;

46166 rows selected.


Execution Plan
----------------------------------------------------------
Plan hash value: 1601196873

--------------------------------------------------------------------------
| Id  | Operation         | Name | Rows  | Bytes | Cost (%CPU)| Time     |
--------------------------------------------------------------------------
|   0 | SELECT STATEMENT  |      | 35871 |    16M|   368   (1)| 00:00:01 |
|*  1 |  TABLE ACCESS FULL| T    | 35871 |    16M|   368   (1)| 00:00:01 |
--------------------------------------------------------------------------

Predicate Information (identified by operation id):
---------------------------------------------------

   1 - filter("OBJECT_ID">60000)

Note
-----
   - dynamic statistics used: dynamic sampling (level=2)


Statistics
----------------------------------------------------------
          9  recursive calls
          0  db block gets
       4452  consistent gets
          0  physical reads
          0  redo size
    2880013  bytes sent via SQL*Net to client
      34454  bytes received via SQL*Net from client
       3079  SQL*Net roundtrips to/from client
          0  sorts (memory)
          0  sorts (disk)
      46166  rows processed

SYS@test>
--会话2 的执行计划
SYS@test>select * from t where object_id >60000;

46166 rows selected.


Execution Plan
----------------------------------------------------------
Plan hash value: 120220905

---------------------------------------------------------------------------------------------
| Id  | Operation                           | Name  | Rows  | Bytes | Cost (%CPU)| Time     |
---------------------------------------------------------------------------------------------
|   0 | SELECT STATEMENT                    |       | 35871 |    16M|   334   (1)| 00:00:01 |
|   1 |  TABLE ACCESS BY INDEX ROWID BATCHED| T     | 35871 |    16M|   334   (1)| 00:00:01 |
|*  2 |   INDEX RANGE SCAN                  | IDX_T | 35871 |       |    28   (0)| 00:00:01 |
---------------------------------------------------------------------------------------------

Predicate Information (identified by operation id):
---------------------------------------------------

   2 - access("OBJECT_ID">60000)

Note
-----
   - dynamic statistics used: dynamic sampling (level=2)


Statistics
----------------------------------------------------------
          0  recursive calls
          0  db block gets
       7488  consistent gets
          0  physical reads
          0  redo size
    6344599  bytes sent via SQL*Net to client
      34454  bytes received via SQL*Net from client
       3079  SQL*Net roundtrips to/from client
          0  sorts (memory)
          0  sorts (disk)
      46166  rows processed

SYS@test>
2 测试,将该参数调整为较大的值,比如调整为120
-- 会话1中
set autotrace traceonly
select * from t where object_id >60000;
--会话2 中
alter session set optimizer_index_cost_adj =120;
set autotrace traceonly
select * from t where object_id >60000;
-- 会话2中的执行计划
SYS@test>alter session set optimizer_index_cost_adj =120;

Session altered.

SYS@test>select * from t where object_id >60000;

46166 rows selected.


Execution Plan
----------------------------------------------------------
Plan hash value: 1601196873

--------------------------------------------------------------------------
| Id  | Operation         | Name | Rows  | Bytes | Cost (%CPU)| Time     |
--------------------------------------------------------------------------
|   0 | SELECT STATEMENT  |      | 35871 |    16M|   368   (1)| 00:00:01 |
|*  1 |  TABLE ACCESS FULL| T    | 35871 |    16M|   368   (1)| 00:00:01 |
--------------------------------------------------------------------------

Predicate Information (identified by operation id):
---------------------------------------------------

   1 - filter("OBJECT_ID">60000)

Note
-----
   - dynamic statistics used: dynamic sampling (level=2)


Statistics
----------------------------------------------------------
          9  recursive calls
          0  db block gets
       4452  consistent gets
          0  physical reads
          0  redo size
    2880013  bytes sent via SQL*Net to client
      34454  bytes received via SQL*Net from client
       3079  SQL*Net roundtrips to/from client
          0  sorts (memory)
          0  sorts (disk)
      46166  rows processed

SYS@test>
结论
这个参数,表示索引扫描和全表扫描的成本的一个比较。缺省值100,表示索引扫描成本,等价转换全表扫描成本。
1 改参数的默认值是100. 当该参数设置为较小的值得时候,比如设置为30 ,更加倾向于使用索引。
2 当该参数设置为较大的值得时候,比如设置为120,更加倾向于使用全表扫描 。
官方文档的一些解释:
OPTIMIZER_INDEX_COST_ADJ
| Property | Description |
|---|---|
| Parameter type | Integer |
| Default value | 100 |
| Modifiable | ALTER SESSION, ALTER SYSTEM |
| Range of values | 1 to 10000 |
OPTIMIZER_INDEX_COST_ADJ lets you tune optimizer behavior for access path selection to be more or less index friendly—that is, to make the optimizer more or less prone to selecting an index access path over a full table scan.
The default for this parameter is 100 percent, at which the optimizer evaluates index access paths at the regular cost. Any other value makes the optimizer evaluate the access path at that percentage of the regular cost. For example, a setting of 50 makes the index access path look half as expensive as normal.
|
| Adjusts the cost of index probes. The range of values is |
END
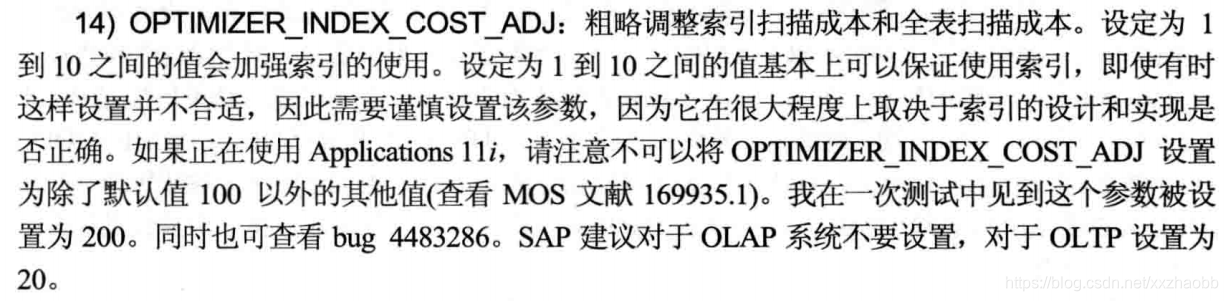
-- 2020-09-10 补充,从其他书上看到的
END


 6086
6086

 被折叠的 条评论
为什么被折叠?
被折叠的 条评论
为什么被折叠?
 到【灌水乐园】发言


