


文章目录
1原文链接
https://blog.csdn.net/qq_40011214/article/details/130552150?spm=1001.2014.3001.5502
- 此文章将会在原文基础上进行改造与优化,某些功能写法可能会不一样
2 实现3D饼图
2.1 渲染文件D3js-pie.vue
<template>
<div class="cneter">
<!-- D3JS实现的3D饼图 -->
<div class="pie-3D" id="pie-3D">
<div class="pie-3D-legend">
<div class="legend" v-for="(item,index) in salesData" :key="index" @click="legendShow(item,index)">
<span class="legend-icon" :style="{ backgroundColor: item.legend ? item.color : '#ccc' }"></span>
<span>{{item.label}}</span>
</div>
</div>
</div>
</div>
</template>
<script>
import pie from '@/utils/pie'
export default {
name: '',
props: {},
components: {},
data () {
return {
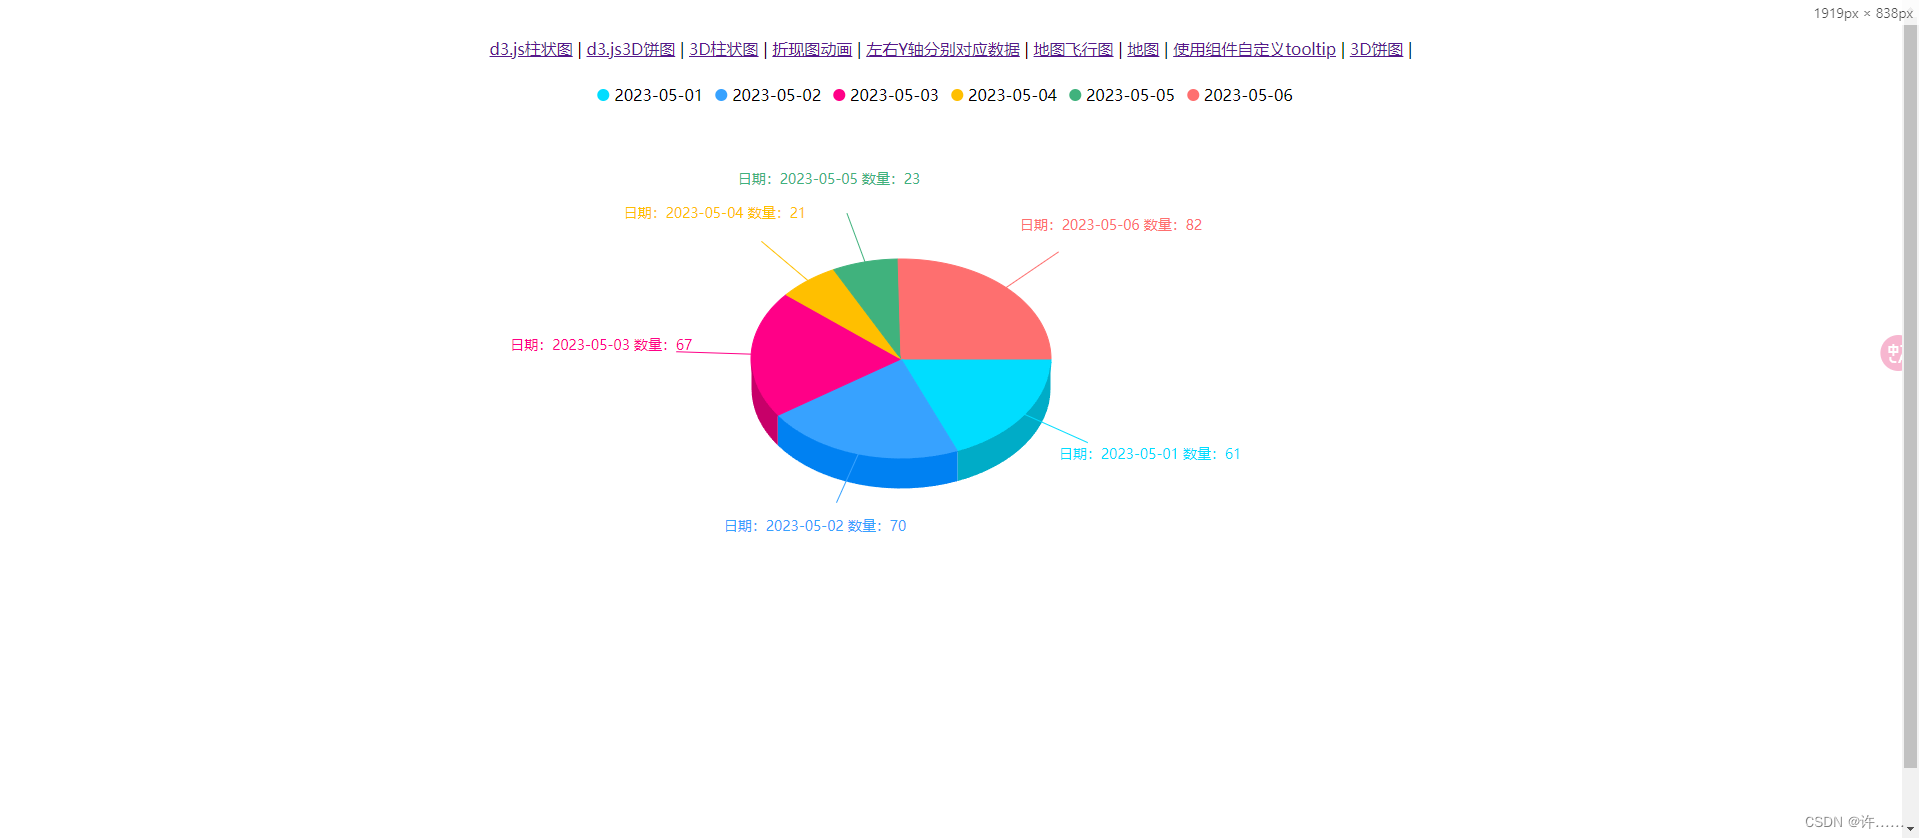
salesData: [
{ label: "2023-05-01", value: 61, legend: true, color: "#00DDFF" },
{ label: "2023-05-02", value: 70, legend: true, color: "#37A2FF" },
{ label: "2023-05-03", value: 67, legend: true, color: "#FF0087" },
{ label: "2023-05-04", value: 21, legend: true, color: "#FFBF00" },
{ label: "2023-05-05", value: 23, legend: true, color: "#40b27d" },
{ label: "2023-05-06", value: 82, legend: true, color: "#fe6f6f" },
],
config: {
sfShowLabel: true
}
}
},
computed: {},
watch: {},
created () { },
mounted () {
this.pieD3init()
},
methods: {
// 控制图例是否显示
legendShow (item, index) {
this.salesData[index].legend = !this.salesData[index].legend
this.pieD3init()
},
pieD3init () {
pie('#pie-3D', '100%', '100%', this.salesData.filter(x => x.legend), 450, 300, 150, 100, 30, this.config)
}
},
}
</script>
<style lang="less" scoped>
.cneter {
width: 100%;
height: 100%;
display: flex;
justify-content: center;
.pie-3D {
width: 1000px;
height: 500px;
position: relative;
.pie-3D-legend {
position: absolute;
left: 50%;
top: 5%;
transform: translateX(-50%);
display: flex;
.legend {
white-space: nowrap;
margin-right: 12px;
cursor: pointer;
.legend-icon {
display: inline-block;
margin-right: 5px;
width: 12px;
height: 12px;
border-radius: 50%;
}
}
}
}
}
</style>
2.2 生成饼图相关配置文件
npm install d3 // 这是我使用的版本 "d3": "^7.8.5",
2.2.1 pie.js文件(@/utils/pie.js)
import * as d3 from 'd3';
import { pieInner, pieTop, pieOuter } from './renderUtils'
/**
 * 生成3d饼图
 * @param {*} id :id唯一标识
 * @param {*} width :svg的宽
 * @param {*} height :svg的高
 * @param {*} data :要渲染的数据
 * @param {*} x :横向偏移量
 * @param {*} y :纵向偏移量
 * @param {*} rx :饼图的横向半径
 * @param {*} ry :饼图的纵向半径
 * @param {*} h :饼图的高度
 */
export default function pie (id, width, height, data, x, y, rx, ry, h, config, ir = 0) {
    //先移除所有的svg
    d3.select(id).selectAll('svg').remove();
    //创建一个svg容器,用来存放饼图
    const pieSvg = d3
        .select(id)
        .append('svg')
        .attr('width', `${width}`)
        .attr('height', `${height}`);
    pieSvg.append('g').attr('id', 'pie_chart');
    //生成饼图数据
    const dataset = d3
        .pie()
        .sort(null)
        .value((d) => {
            return d.value
        })(data);
    // 获取上面插入的g
    const slices = d3
        .select('#pie_chart')
        .append('g')
        .attr('transform', `translate(${x},${y})`)
        .attr('class', 'slices')
        .style('cursor', 'pointer');
    // 添加tips
    const tips = d3.select(id)
        .append("div")
        .style("visibility", "hidden")
        .style('position', 'absolute')
        .style("background-color", "white")
        .style("padding", "0px")
    //添加事件
    slices.on('mouseover', function () {
        tips.style("visibility", "visible")
    })
        .on('mousemove', function (event) {
            // console.log(event);  // 鼠标事件对象
            // console.log(this);  // 这里的this就表示当前选择的元素
            let element = d3.pointer(event, this) //d3.pointer(事件, target) 获取鼠标的x,y 坐标。 d3.pointer()方法,详细可以看我上一篇推文
            // console.log(element);
            tips.style("visibility", "visible")
                .style('left', element[0] + (event.pageX - element[0]) + 20 + 'px')
                .style('top', element[1] + (event.pageY - element[1]) + 'px')
                .html(
                    `<div style='padding:5px;border:1px solid ${event.target.__data__.data.color};color:${event.target.__data__.data.color}'>` + `日期:${event.target.__data__.data.label} ,数量: ${event.target.__data__.data.value}` + '</div>'
                )
        })
        .on('mouseleave', function () {
            tips.style("visibility", "hidden")
        });
    //生成环形内曲面
    slices.selectAll('.innerSlice')
        .data(dataset)
        .enter()
        .append('path')
        .attr('class', 'innerSlice')
        .style('fill', (d, index) => {
            return d3.hsl(d.data.color).darker(0.7)
        })
        .attr('d', d => {
            return pieInner(d, rx + 0.5, ry + 0.5, h, ir)
        });
    //上层2D平面
    slices.selectAll('.topSlice')
        .data(dataset)
        .enter()
        .append('path')
        .transition()
        .delay(0)
        .duration(500)
        .attrTween('d', (d) => {
            //动画效果
            let interpolate = d3.interpolate(d.startAngle, d.endAngle);
            return function (t) {
                d.endAngle = interpolate(t);
                return pieTop(d, rx, ry, ir)
            }
        })
        .attr('class', 'topSlice')
        .style('fill', (d, index) => {
            return d.data.color
        })
        .style('stroke', (d, index) => {
            return d.data.color
        })
    //侧面曲面
    slices.selectAll('.outerSlice')
        .data(dataset)
        .enter()
        .append('path')
        .transition()
        .delay(0)
        .duration(500)
        .attrTween('d', (d) => {
            //动画效果
            let interpolate = d3.interpolate(d.startAngle, d.endAngle);
            return function (t) {
                d.endAngle = interpolate(t);
                return pieOuter(d, rx - 0.5, ry - 0.5, h)
            }
        })
        .attr('class', 'outerSlice')
        .style('fill', (d, index) => {
            return d3.hsl(d.data.color).darker(0.7)
        });

    //是否显示标签
    if (config.sfShowLabel) {
        //创建文本标签引导线
        const line = d3.select('#pie_chart')
            .append('g')
            .attr('transform', `translate(${x},${y})`)
            .attr('class', 'line');
        //引导线
        line.selectAll('.line')
            .data(dataset)
            .enter()
            .append('line')
            .attr('stroke', (d, index) => {
                return d.data.color
            })
            .attr('x1', 0)
            .attr('y1', 0)
            .attr('x2', d => {
                return 1.5 * rx * Math.cos(0.5 * (d.startAngle + d.endAngle))
            })
            .attr('y2', d => {
                return 1.5 * ry * Math.sin(0.5 * (d.startAngle + d.endAngle))
            })
            .style('visibility', d => {
                return 'visible'
            });
        //文本
        const textbox = d3.select('#pie_chart')
            .append('g')
            .attr('transform', `translate(${x},${y})`)
            .attr('class', 'textbox');
        const text = textbox.selectAll('desc')
            .data(dataset)
            .enter()
            .append('text')
            .attr('font-size', '14px')
            .attr('text-anchor', 'middle')
            .style('visibility', d => {
                return 'visible'
            })
            .attr('fill', (d, index) => {
                return d.data.color
            })
            .text(d => {
                return `日期:${d.data.label}  数量:${d.data.value}`
            })
            .attr('transform', d => {
                let x = 1.5 * (rx + 50) * Math.cos(0.5 * (d.startAngle + d.endAngle))
                let y = 1.5 * (ry + 20) * Math.sin(0.5 * (d.startAngle + d.endAngle))
                return `translate(${x},${y})`
            })

    }
}
2.2.2 renderUtils.js文件(@/utils/renderUtils.js)
//生成内曲面
export function pieInner(d,rx,ry,h,ir){
  const startAngle = d.startAngle < Math.PI ? Math.PI : d.startAngle;
  const endAngle = d.endAngle < Math.PI ? Math.PI : d.endAngle;

  const sx = ir * rx * Math.cos(startAngle);
  const sy = ir * ry * Math.sin(startAngle);
  const ex = ir * rx * Math.cos(endAngle);
  const ey = ir * ry * Math.sin(endAngle);

  const ret = [];
  ret.push(
      'M',
      sx,
      sy,
      'A',
      ir * rx,
      ir * ry,
      '0 0 1',
      ex,
      ey,
      'L',
      ex,
      h + ey,
      'A',
      ir * rx,
      ir * ry,
      '0 0 0',
      sx,
      h + sy,
      'z'
  );
  return ret.join(' ');
}
// 生成饼图的顶部
export function pieTop(d, rx, ry, ir) {
  if (d.endAngle - d.startAngle === 0) { return 'M 0 0'; }
  const sx = rx * Math.cos(d.startAngle);
  const sy = ry * Math.sin(d.startAngle);
  const ex = rx * Math.cos(d.endAngle);
  const ey = ry * Math.sin(d.endAngle);

  const ret = [];
  ret.push(
      'M',
      sx,
      sy,
      'A',
      rx,
      ry,
      '0',
      d.endAngle - d.startAngle > Math.PI ? 1 : 0,
      '1',
      ex,
      ey,
      'L',
      ir * ex,
      ir * ey
  );
  ret.push(
      'A',
      ir * rx,
      ir * ry,
      '0',
      d.endAngle - d.startAngle > Math.PI ? 1 : 0,
      '0',
      ir * sx,
      ir * sy,
      'z'
  );
  return ret.join(' ');
}

// 外曲面算法
export function pieOuter(d, rx, ry, h) {
  const startAngle = d.startAngle > Math.PI ? Math.PI : d.startAngle;
  const endAngle = d.endAngle > Math.PI ? Math.PI : d.endAngle;

  const sx = rx * Math.cos(startAngle);
  const sy = ry * Math.sin(startAngle);
  const ex = rx * Math.cos(endAngle);
  const ey = ry * Math.sin(endAngle);

  const ret = [];
  ret.push(
      'M',
      sx,
      h + sy,
      'A',
      rx,
      ry,
      '0 0 1',
      ex,
      h + ey,
      'L',
      ex,
      ey,
      'A',
      rx,
      ry,
      '0 0 0',
      sx,
      sy,
      'z'
  );
  return ret.join(' ');
}


 8054
8054

 被折叠的 条评论
为什么被折叠?
被折叠的 条评论
为什么被折叠?
 到【灌水乐园】发言


