


最近用matlab画图,主要涉及的matlab函数是:
VideoWriter:保存视频的新函数,取代了之前的movie2avi。需要结合writeVideo函数。
quiver:速度矢量绘图函数。
做了一些动画效果的视频,截取效果如下:
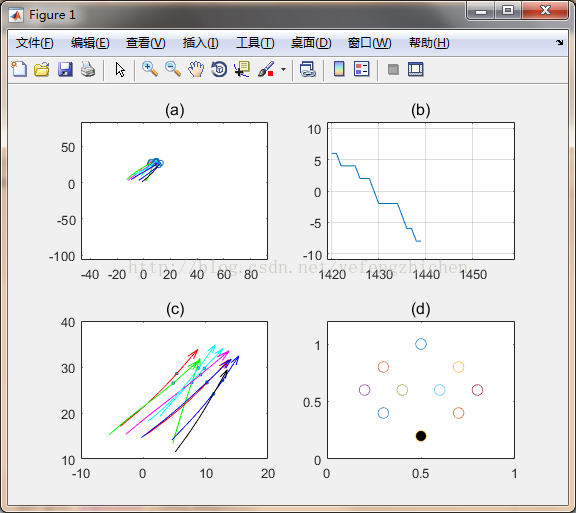
主要功能:1、显示目标在整个过程中的运动轨迹如图a所示
2、显示目标的方向变化情况,右转为正,左转为负,如图b所示
3、显示之前轨迹和当前方向的比较,如图c所示
4、显示目标之间的方向变化的前后关系以及网络,如图d所示。
代码如下:
clc
clear

% M(i)=getframe;
% i=i+1;
% moviename=  strcat('prediction.avi');
%movie2avi(M,moviename,'fps',1);% title('Toggle Switch Dynamics (Simulation Versus Real Data)','FontSize',20);

%1360 - 1960  - 2560

load('posi.mat');
load('index2.mat');

% pos = posi(1360:1960, :, :);
% index = index(1360:1960, :);
startIndex = 1360;
endIndex = 2560;
showLen = 20;  %(a)(b)图的轨迹长度
direcLen = 1;  %(c)图的方向箭头,取得后面第几个点,1为下一个点
tailLen = 10;  %(c)图的尾部长度
types ='rgbcmkrgbc'; %{'r'; 'g.'; 'b.'; 'c.'; 'm.'; 'y.'; 'k.'; 'r.'; 'g.';'b.'};
figure;
f_index = 1;
wobj = VideoWriter('newmove.avi');
wobj.FrameRate = 10;
open(wobj);
xmax= max(max(max(posi(startIndex:endIndex,1, :))));
xmin= min(min(min(posi(startIndex:endIndex,1, :))));
ymax= max(max(max(posi(startIndex:endIndex,2, :))));
ymin= min(min(min(posi(startIndex:endIndex,2, :))));
spos = [];
sindex = [];
for i = startIndex:endIndex-1
    posLen = size(spos, 1);
    if posLen<showLen
        spos(posLen + 1, :, :) = posi(i,:,:);
        sindex(posLen + 1) = index2(i);
        if posLen < showLen-1
            continue
        end
    else
        spos = spos(2:end,:,:);
        spos(posLen, :, :) = posi(i,:,:);
        sindex = sindex(2:end);
        sindex(posLen) = index2(i);
    end
    %运行到此处 posLen一定为showLen
    subplot(2,2,1)
    cla
    title('(a)', 'FontSize',12);
    posLen = size(spos, 1);
    x1 = posi(i, 1, :);
    x1 = reshape(x1, 1, 10);
    y1 = posi(i, 2, :);
    y1 = reshape(y1, 1, 10);
    plot(x1, y1, 'o','MarkerSize',4);
    hold on
    for j = 1:10
        xtmp = spos(:,1,j);
        x2 = reshape(xtmp, 1, posLen);
        ytmp = spos(:,2,j);
        y2 = reshape(ytmp, 1, posLen);
        plot(x2, y2, types(j));
        hold on
    end
    axis([xmin-5,xmax+5,ymin-5,ymax+5])

    subplot(2,2,2)
    cla
    title('(b)', 'FontSize',12);
    x3 = i-19:i;
    y3 = sindex;
    plot(x3, y3);
    hold on;
    grid on;
    axis([i-20,i+20,-11,11])

    f3 = subplot(2,2,3);
    cla
    title('(c)', 'FontSize',12);
    posLen = size(spos, 1);
    x4 = posi(i, 1, :);
    x4 = reshape(x4, 1, 10);
    y4 = posi(i, 2, :);
    y4 = reshape(y4, 1, 10);
    plot(x4, y4, 'o','MarkerSize',2);
    x4_1 = posi(i + direcLen, 1, :);
    x4_1 = reshape(x4_1, 1, 10);
    y4_1 = posi(i + direcLen, 2, :);
    y4_1 = reshape(y4_1, 1, 10);
    for j = 1:10
        xtmp = spos(:,1,j);
        x5 = reshape(xtmp, 1, posLen);
        ytmp = spos(:,2,j);
        y5 = reshape(ytmp, 1, posLen);
        plot(x5(:, showLen - tailLen : end), y5(:, showLen - tailLen : end), types(j));
        hold on;
        quiver(x4(j), y4(j), x4_1(j) - x4(j), y4_1(j) - y4(j), 4, types(j), 'maxheadsize',2);
        hold on;
    end
%    quiver(x4, y4, x4_1 - x4, y4_1 - y4,'b');
%     axis([xmin-5,xmax+5,ymin-5,ymax+5])

    subplot(2,2,4)
    cla
    title('(d)', 'FontSize',12);
    y6 = [1.0, 0.8, 0.8, 0.6, 0.6, 0.6, 0.6, 0.4, 0.4, 0.2];
    x6 = [0.5, 0.3, 0.7, 0.2, 0.4, 0.6, 0.8, 0.3, 0.7, 0.5];
    colors = zeros(10, 3);
    num = (10 - index2(i))/2;
    for j = 1:num
        colors(j,:)=[1,1,1];
    end
    for j = 1:10
        plot(x6(j), y6(j), 'o','MarkerSize',8, 'markerfacecolor', colors(j,:));
        hold on;
    end
    axis([0,1,0,1.2])
    set(gcf,'papersize',[800,600]);
    frame=getframe(gcf);
    writeVideo(wobj, frame);
end
close(wobj)


 1858
1858


 被折叠的 条评论
为什么被折叠?
被折叠的 条评论
为什么被折叠?
 到【灌水乐园】发言


