


先看效果:
mounted() {
this.myChart = this.$echarts.init(document.getElementById("main5"));
this.option = {
backgroundColor: "#E5EEF9",
title: {
show: false,
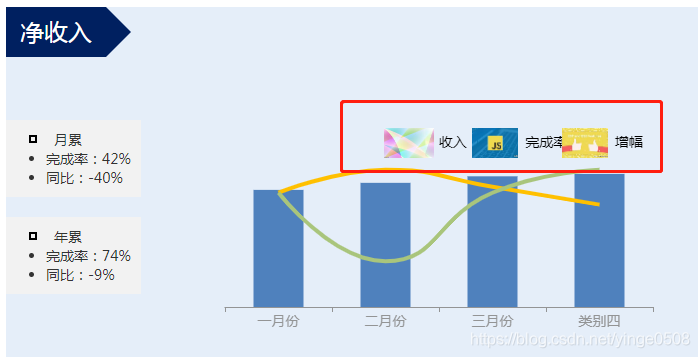
text: "净收入",
textStyle: {
color: "#fff",
fontSize: 26
},
left: 0,
backgroundColor: "rgba(0,32,96,1)",
borderColor: "#000"
},
tooltip: {
trigger: "axis",
axisPointer: { type: "shadow" }
},
grid: {
top: "25%",
right: "45",
bottom: "20",
left: "30"
},
// 图例设置
legend: [
{
top: "15%",
right: "45%",
textStyle: {
// 图例文字样式
color: "black",
fontSize: 14,
fontFamily: "微软雅黑"
},
itemWidth: 33, // 图例图形的宽度
itemHeight: 12, // 图例图形的高度
data: [
{
name: "收入", // 图例文字内容
icon: "roundRect" // 图例图形的形状,有多个可选值:'circle', 'rect', 'roundRect', 'triangle', 'diamond', 'pin', 'arrow', 'none',
//也可引用自定义的图片
// icon: "image://https://p1.pstatp.com/list/dfic-imagehandler/8ac89fbe-b30c-4ba0-8d75-02c0f60a7ea6"
}
]
},
{
top: "15%",
right: "25%",
textStyle: {
color: "black",
fontSize: 14,
fontFamily: "微软雅黑"
},
itemWidth: 33,
itemHeight: 12,
data: [
{
name: "完成率",
icon: "roundRect" //引用自定义的图片
}
]
},
{
top: "15%",
right: "10%",
textStyle: {
color: "black",
fontSize: 14,
fontFamily: "微软雅黑"
},
itemWidth: 33,
itemHeight: 12,
data: [
{
name: "增幅",
icon: "roundRect" //引用自定义的图片
}
]
}
],
xAxis: [
{
type: "category",
data: ["一月份", "二月份", "三月份", "类别四"],
axisLine: { lineStyle: { color: "#939495" } },
axisLabel: {
textStyle: { color: "#939495", fontSize: "14" }
}
}
],
yAxis: [
{
show: false,
type: "value",
name: "",
splitLine: {
show: false
},
axisLabel: {
show: true,
fontSize: 14,
color: "#939495"
},
axisLine: {
min: 0,
max: 10,
lineStyle: { color: "#939495" }
} //左线色
},
{
show: false,
type: "value",
name: "",
axisLabel: {
show: true,
fontSize: 14,
formatter: "{value} %",
color: "#939495"
},
axisLine: { lineStyle: { color: "#939495" } }, //右线色
splitLine: {
show: false,
lineStyle: { color: "#939495" }
} //x轴线
}
],
series: [
{
name: "收入",
type: "bar",
data: [36.6, 38.8, 40.84, 41.6],
barWidth: "50",
itemStyle: {
normal: {
barBorderRadius: 0,
color: "#4F81BD"
}
},
barGap: "0.2"
},
{
name: "完成率",
type: "line",
yAxisIndex: 1,
data: [5, 6.01, 5.26, 4.48],
lineStyle: {
normal: {
width: 4
}
},
symbol: "none",
itemStyle: {
normal: {
color: "#FFC000"
}
},
smooth: true
},
{
name: "增幅",
type: "line",
yAxisIndex: 1,
data: [5, 2, 5, 6],
lineStyle: {
normal: {
width: 4
}
},
symbol: "none",
itemStyle: {
normal: {
color: "#A9C57C"
}
},
smooth: true
}
]
};
this.myChart.setOption(this.option);
window.addEventListener("resize", function() {
this.myChart.resize();
});
}


 241
241

 被折叠的 条评论
为什么被折叠?
被折叠的 条评论
为什么被折叠?
 到【灌水乐园】发言


