


先看效果:图一:
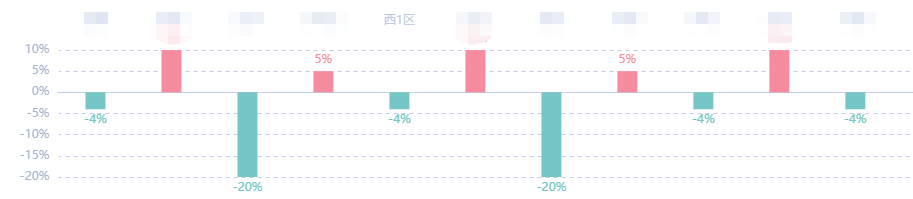
图二:
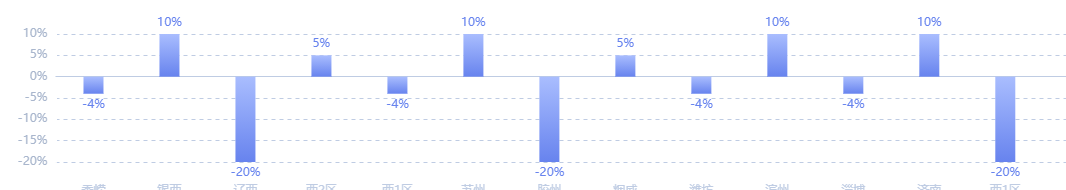
数值大于零的在x轴上方,label在柱状图上方,小于零的在x轴下方,label在轴下方;相关代码如下:
<template>
  <div>
    <ChartTitle :name="config.titleName1" />
    <div id="areaRate"></div>
    <ChartTitle :name="config.titleName2" />
    <div id="difference"></div>
  </div>
</template>
<script>
import { fontSize } from "@/utils/fn";
import ChartTitle from "@/components/welcome/chartTitle";
import bus from "@/components/js/bus";
let fs16 = fontSize(0.16);
let fs36 = fontSize(0.36);
let fs18 = fontSize(0.18);
let list = [];
export default {
  components: { ChartTitle },
  data() {
    return {
      myChart: null,
      myChart2: null,
    };
  },
  props: {
    config: {
      type: Object,
      default: () => {},
    },
  },
  mounted() {
    // window.addEventListener("resize", this.resizeMyChart);
    // bus.$on("collapse", (msg) => {
    // });
    this.initChart();
    this.initChart2();
  },
  destroyed() {
    // window.removeEventListener("resize", this.resizeMyChart);
  },
  methods: {
    initChart() {
      this.myChart = this.$echarts.init(document.getElementById("areaRate"));
      let colorList = [
        {
          type: "linear",
          x: 0,
          y: 0,
          x2: 0,
          y2: 1,
          colorStops: [
            {
              offset: 0,
              color: this.config.oneTopColors[0], // 0% 处的颜色
            },
            {
              offset: 1,
              color: this.config.oneTopColors[1], // 100% 处的颜色
            },
          ],
          global: false, // 缺省为 false
        },
        {
          type: "linear",
          x: 0,
          y: 0,
          x2: 0,
          y2: 1,
          colorStops: [
            {
              offset: 0,
              color: this.config.oneBottomColors[0], // 0% 处的颜色
            },
            {
              offset: 1,
              color: this.config.oneBottomColors[1], // 100% 处的颜色
            },
          ],
          global: false, // 缺省为 false
        },
      ];
      let option = {
        grid: {
            left: '5%',
            right: '3%',
        },
        tooltip: {
          formatter: "{b}<br>{a}:{c}",
        },
        toolbox: {
          show: false,
        },
        xAxis: [
          {
            position: "bottom",
            type: "category",
            nameLocation: "middle",
            offset:15,
            nameGap: 0,
            data: this.config.dataX,
            splitLine:{
                show:false,
                color: ["#BFCCE3"]
            },
            axisTick:{
                show:false
            },
            axisLine: {
              lineStyle: {
                color: 'rgb(191,204,227)',
                type: 'solid'
              }
            }
          },
        ],
        yAxis: [
           {
            type: "value",
            show: true,
            axisLine: {
                   lineStyle: {
                       color:'#fff',
                       width:'2'
                   }
               },
            splitLine: {
              show: true,
              lineStyle: {
                  color:['#BFCCE3'],
                  type: 'dashed'
              }
            },
            axisLabel:{
                show: true,
                color: "#A9B6CD",
                formatter: '{value}%'
            }
          },
        ],
        series: [
          {
            name: "学段课收增长率",
            type: "bar",
            fontSize: 20,
            barWidth: 60,
            // barGap: 1,
            // barCategoryGap: 20,
            data: this.config.dataTop.map(item => {
              return {
                value: item,
                label: {
                  // 设置显示label
                  show: true,
                  // 设置label的位置
                  position: item > 0 ? 'top' : 'bottom',
                  // 设置label的文字颜色
                  color: '#6783EE',
                  // 格式化label文字
                  formatter: item > 0 ? '+'+'{c}%' : '{c}%'
                },
                itemStyle:{
                  color: item > 0 ? colorList[0] : colorList[1],
                  barBorderRadius: item > 0 ? [5, 5, 0, 0] : [0, 0, 5, 5]
                }
              }
            }),
          },
        ],
      };
      this.myChart.setOption(option, true);
    },
    initChart2() {
      this.myChart2 = this.$echarts.init(document.getElementById("difference"));
      let colorList = [
        {
          type: "linear",
          x: 0,
          y: 0,
          x2: 0,
          y2: 1,
          colorStops: [
            {
              offset: 0,
              color: this.config.twoTopColors[0], // 0% 处的颜色
            },
            {
              offset: 1,
              color: this.config.twoTopColors[1], // 100% 处的颜色
            },
          ],
          global: false, // 缺省为 false
        },
        {
          type: "linear",
          x: 0,
          y: 0,
          x2: 0,
          y2: 1,
          colorStops: [
            {
              offset: 0,
              color: this.config.twoBottomColors[0], // 0% 处的颜色
            },
            {
              offset: 1,
              color: this.config.twoBottomColors[1], // 100% 处的颜色
            },
          ],
          global: false, // 缺省为 false
        },
      ];

      let option = {
        // 直角坐标系内绘图网格
        grid: {
            left: '5%', // grid 组件离容器左侧的距离
            right: '3%',  // grid 组件离容器右侧的距离
        },
        // 提示框设置
        tooltip: {
          // 提示框浮层内容格式器
          formatter: "{b}<br>{a}:{c}",
        },
        toolbox: {
          show: false,
        },
        xAxis: [
          {
            position: "top", // x 轴的位置。
            type: "category", // 坐标轴类型。
            nameLocation: "middle", // 坐标轴名称显示位置。
            offset:15, // X 轴相对于默认位置的偏移
            nameGap: 0, // 坐标轴名称与轴线之间的距离。
            data: this.config.dataX,
            // 分割线设置
            splitLine:{
                show:false
            },
            // 坐标轴刻度相关设置。
            axisTick:{
                show:false
            },
            // 坐标轴轴线相关设置。
            axisLine: {
              lineStyle: {
                color: 'rgb(191,204,227)',
                type: 'solid'
              }
            }
          },
        ],
        yAxis: [
           {
            type: "value",
            show: true,
            // 坐标轴轴线相关设置
            axisLine: {
                   lineStyle: {
                       color:'#fff', // 坐标轴线线的颜色
                       width:'2' // 坐标轴线线的宽度
                   }
               },
            //  y轴分割线设置
            splitLine: {
              show: true, // 是否显示分割线
              lineStyle: {
                  color:['#BFCCE3'], // 分割线颜色
                  type: 'dashed' // 分割线类型
              }
            },
            // 坐标轴刻度标签的相关设置。
            axisLabel:{
                show: true, // 坐标轴标签是否显示
                color: "#A9B6CD", // 坐标轴标签颜色
                formatter: '{value}%' // 坐标轴标签文案
            }
          },
        ],
        series: [
          {
            name: "学段课收差额",
            type: "bar",
            fontSize: 20,
            // 标签设置
            label: {
              normal: {
                show: true, // 标签
                // 标签内容格式化
                formatter: function(data){
                  if(data.value > 0){
                    return '{a|' + '+' + data.value + '%}'
                  } else {
                    return '{b|' + data.value + '%}'
                  }
                },
                // 自定义样式
                rich: {
                  a: {
                    // 颜色设置
                      color: '#F68C9D',
                  },
                  b: {
                    // 颜色设置
                      color: '#74C7C6'
                  }
                }
              }
            },
            // 柱条的宽度
            barWidth: 60,
            data: this.config.dataBottom.map(item => {
              return {
                value: item,
                label: {
                  // 设置显示label
                  show: true,
                  // 设置label的位置
                  position: item > 0 ? 'top' : 'bottom',
                },
                itemStyle: {
                  // 设置柱条的背景色
                  color: item > 0 ? '#F68C9D' : '#74C7C6',
                  barBorderRadius: item > 0 ? [5, 5, 0, 0] : [0, 0, 5, 5] // 设置倒角
                }
              }
            }),
          },
        ],
      };
      this.myChart2.setOption(option, true);
    },
  },
};
</script>
<style lang='less' scoped>
#areaRate {
  height: 2.8rem;
}
#difference {
  height: 2.8rem;
}
</style>


 8万+
8万+


 被折叠的 条评论
为什么被折叠?
被折叠的 条评论
为什么被折叠?
 到【灌水乐园】发言


