


目录:
| perf list | perf stat | perf record |
|---|---|---|
| perf top | perf report | 内核tracepoint的使用 |
| perf timechart | perf script |
Perf的功能
评估程序对硬件资源的使用情况:
各级Cache访问次数、各级Cache丢失次数、流水线 停顿周期、前端总线访问次数 …
评估程序对操作系统资源的使用情况:
系统调用次数、Page Fault次数、上下文切换次数、任 务迁移次数 …
评估内核性能
Benchmarks、调度器性能分析、系统行为记录与重演 动态添加探测点 … …
Perf原理
Ⅰ. 性能事件
-
硬件相关: CPU Cycles、Instructions、Cache-References、 Cache-Misses、Bus-Cycles、Branch-Misses …
-
OS相关: –Page-Faults、 Context-Switches、CPUMigrations、Emulation-Faults、Task-Clock …
-
Tracepoint: 内核中所有的 Tracepoint,都可以作为 perf 的性能事件
1. 硬件性能事件 (PMU)
PMU (Performance Monitoring Unit)即为性能监测单元
- CPU部件:监测处理器性能 – Core PMU & Uncore PMU
- 性能事件探测器: 在特定条件下探测性能事件是否发生
- 性能事件计数器: 记录性能事件发生的次数
PMU能够侦测的事件
- Program Characterization 项目描述
- Memory Accesses 内存访问
- Pipeline stalls 管道阻塞
- Branch Prediction 分支预测
- Resource Utilization 资源利用
2. 软件性能事件
- 内置于kernel,分布在各个功能模块中
- 统计与操作系统相关的性能事件
- 如: 任务执行时间( HRTimer )上下文切换次数 任务迁移次数 等
3. Tracepoint
Ⅱ. 基于时间的性能分析
程序热点的查找 — 找到程序中执行最频繁的热点代码
周期性中断应用程序(周期性采样)
- 记录当前指令地址(保存Instruction Pointer [PC])
- IP -> function name
假定当前采样周期内一直在执行此函数
函数的处理器利用率:= 函数执行时间 / 程序总执行时间
采样频率 → 分析精度
Ⅲ. 基于事件的性能分析
针对时间无关的性能指标
- 哪个函数/指令触发了最多的Cache missing ?
- 程序执行期间发生了多少次任务切换 ?
- 哪个程序使用的系统调用数最多?
性能计数器
- 性能计数器累积到一定数值(采样周期)时触发中断
- ISR记录当前进程的采样信息:PC,PID,TID等
热点进程 / 热点函数 / 热点指令
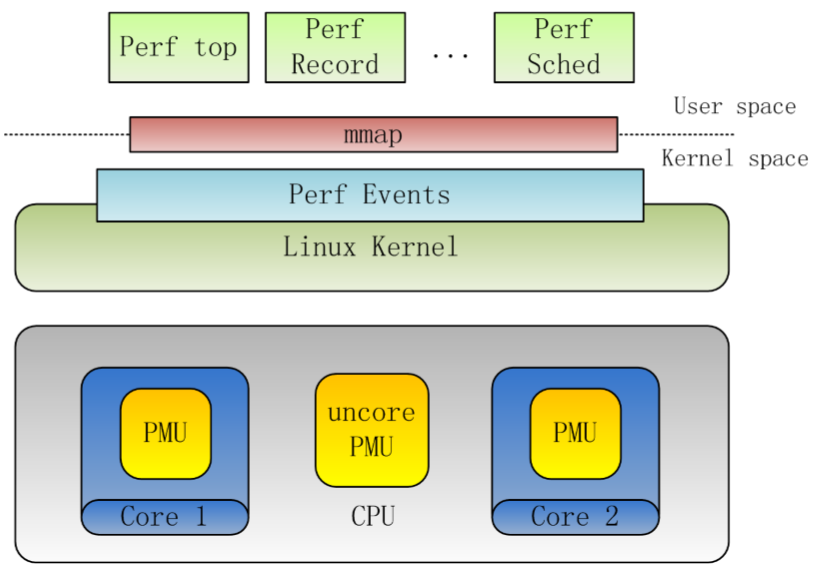
Perf的结构
Perf使用方法
- perf list
- perf stat
- perf top
- perf record
- perf report
- Tracepoint
- perf sched
- perf timechart
- perf script
perf list
功能:
- 查看当前软硬件环境 支持的性能事件
- 性能事件与CPU及内核 版本相关
使用方法:
perf list
perf stat
功能 分析程序的整体性能
使用方法:
perf stat ./a.out
常用参数:
-e:指定性能事件-p:指定待分析进程的PID-t:指定待分析线程的TID
常用参数(cont.)
-r N:连续分析N次-d:全面性能分析,采用更多的性能事件
输出信息:
Performance counter stats for './a.out':

            157.03 msec task-clock                #    0.992 CPUs utilized
                29      context-switches          #    0.185 K/sec
                 0      cpu-migrations            #    0.000 K/sec
                50      page-faults               #    0.318 K/sec
   <not supported>      cycles
   <not supported>      instructions
   <not supported>      branches
   <not supported>      branch-misses

       0.158345840 seconds time elapsed

       0.157265000 seconds user
       0.000000000 seconds sys
例:
1. 分支预测失效:
void func(void)
{
	int NUM = 20;
	int i, res;
	for (i = 0; i < NUM; i++)
	{
		res += 1;
	}
}

int main(void) {
	int i;
	for (i = 0; i < 100000000; i++)
		func();
	return 0;
}
结果:
Performance counter stats for './a.out':

          2,663.00 msec task-clock                #    0.997 CPUs utilized
               366      context-switches          #    0.137 K/sec
                 0      cpu-migrations            #    0.000 K/sec
                48      page-faults               #    0.018 K/sec
   <not supported>      cycles
   <not supported>      instructions
   <not supported>      branches
   <not supported>      branch-misses

       2.670945408 seconds time elapsed

       2.662602000 seconds user
       0.000000000 seconds sys
2. 修改后的代码:
void func(void) {
	int NUM = 10;
	int i, res;
	for (i = 0; i < NUM; i++)
	{
		res += 2;
	}
}
int main(void)
{
	int i;
	for (i = 0; i < 100000000; i++)
		func();
	return 0;
}
结果优于之前的代码:
Performance counter stats for './a.out':

          1,330.82 msec task-clock                #    0.997 CPUs utilized
               193      context-switches          #    0.145 K/sec
                 0      cpu-migrations            #    0.000 K/sec
                44      page-faults               #    0.033 K/sec
   <not supported>      cycles
   <not supported>      instructions
   <not supported>      branches
   <not supported>      branch-misses

       1.335294968 seconds time elapsed

       1.330658000 seconds user
       0.000000000 seconds sys
perf record
功能
记录一段时间内系统/进程的性能事件
使用方法
perf record [options] [<command>]
perf record [options] -- <command> [options]
常用参数
-e:指定性能事件(默认事件:cycles)-p:指定待分析进程的PID-t:指定待分析线程的TID
常用参数 (cont.)
-a:分析整个系统的性能(Default)-c:事件的采样周期-o:指定输出文件(Default: perf.data)-g:记录函数间的调用关系-r <priority>:将perf top作为实时任务,优先级为-u <uid>:只分析用户创建的进程
输出信息
默认在当前目录下生成数据文件: perf.data
perf top
功能 :
实时显示系统/进程的性能统计信息
使用方法 :
perf top
常用参数:
-e:指定性能事件(默认事件:cycles)-p:指定待分析进程的PID-t:指定待分析线程的TID
常用参数 (cont.)
-a:分析整个系统的性能(Default)-c:事件的采样周期-d:界面的刷新周期(Default:2s)-E:显示的函数条数-r <priority>:将perf top作为实时任务,优先级为<priority>-K:不显示内核符号-U:不显示用户符号
输出信息
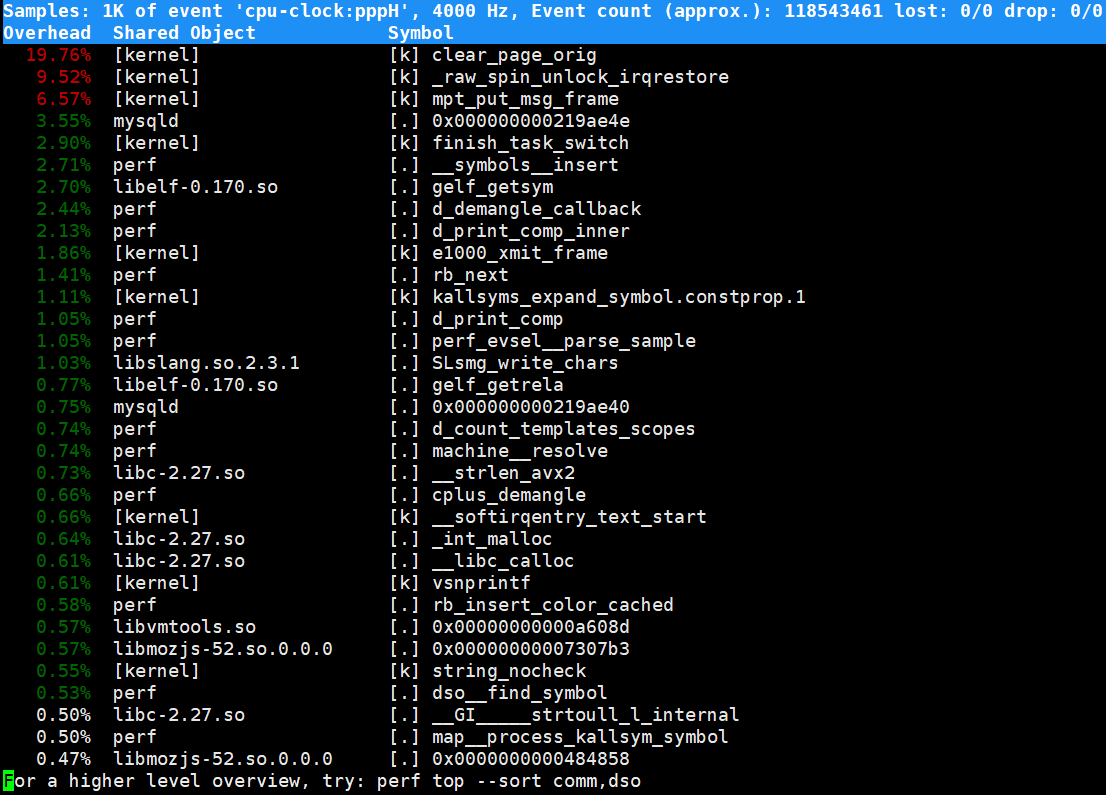
Annotate: 将性能分析细化到指令
perf report
功能
读取perf record生成的perf.data文件,并显示分析数据
使用方法
perf report [-i <file> | --input=file]
常用参数
-i:输入文件名-v:显示每个符号的地址-d<dso>:只显示指定dso的符号
常用参数(cont.)
-n显示每个符号对应的事件数-v显示每个符号的地址--comms=<comm>只显示指定comm的信息-S <symbol name>只考虑指定符号-U只显示已解析的符号-g [type,min]’按照 [type,min] 指定的方式显示函数调用图
type:
flat : 线性展开所有调用链
graph :显示调用树,并显示每个调用树对应的绝对开销率
fractal : 显示调用树,并显示每个调用树对应的相对开销率
min: 只显示开销率大于min 的符号
内核tracepoint的使用
Tracepoint
- 在内核的 tracepoint 中可以插入hook function,以追踪内核的执行流。
- Perf 将 tracepoint 作为性能事件
使用方法
1.
使用 perf list 查看当前系统支持的tracepoint
2.
perf top [record] –e module:function <other options>
Example: 统计程序使用的系统调用数
perf stat -e raw_syscalls:sys_enter ls
得到
 Performance counter stats for 'ls':

                93      raw_syscalls:sys_enter

       0.001518473 seconds time elapsed

       0.001089000 seconds user
       0.000000000 seconds sys
ls 在执行期间共调用了 93次系统调用
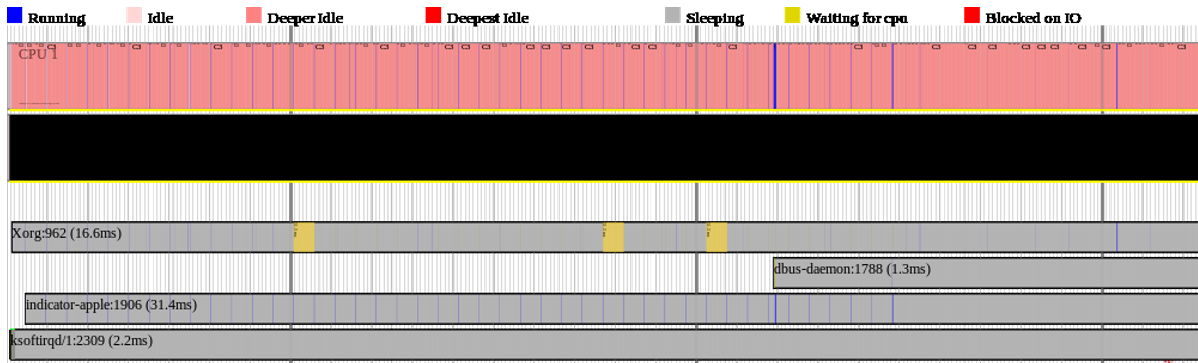
perf timechart
功能
将系统的运行状态以SVG图的形式输出。
- 各处理器状态 (run, idle)
- 各进程的时间图谱(run, sleep, blocked …)
使用方法:
1. 记录系统状态
perf timechart record
2. 绘制系统状态图
perf timechart
输出:
output.svg
perf script
功能
- 查看perf的数据文件( perf.data )
- 执行基于python/perl的扩展功能( 需要python环境 )
使用方法
1.查看perf的数据文件
perf script
2.使用perf的扩展脚本
查看系统中当前可用的扩展脚本
perf script -l
使用方法(cont.)
使用perf的扩展脚本(cont.)
- syscall-count 统计监测时段内,各个系统调用被调度的次数
perf script syscall-count
- sctop 实时查看各个系统调用被调用的次数
perf script sctop
- sched-migration 以图形显示监测时段内,各个任务在处理器间的迁移情况。
perf script sched-migration


 173
173


 被折叠的 条评论
为什么被折叠?
被折叠的 条评论
为什么被折叠?
 到【灌水乐园】发言


