


 本文介绍了在Vue应用中遇到的Echarts错误,由于Vue的响应式系统与Echarts状态管理冲突,提出了解决方案:使用`markRaw`标记Echarts实例并取消Vue对Echarts变化的观察,以实现Echarts的自动更新。
报错: Uncaught TypeError: Cannot read properties of undefined (reading 'type')
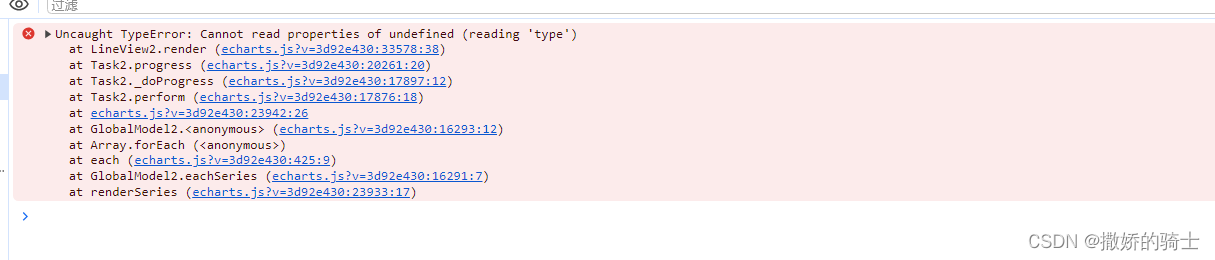
原因: Echarts 管理的状态和数据与 Vue 的响应式产生冲突,导致Echarts 无法正常更新而报错。
解决:取消 VUE 的响应式系统观测 Echarts 的变化更新,让Echarts 自动更新。
markRaw 将 Echarts 实例标记为原始对象
// 导入 markRaw
import { markRaw } from 'vue';

const chartInstance: any = ref(null);
// 标记这个DOM对象, Vue 不要将其转换为响应式数据。
chartInstance.value = markRaw(echarts.init( document.getElementById('chartline'))) ;
另外 在 VUE 中如果想实时绘制Echarts的话,需要手动的调用 setOption(option, true)
完整使用代码:
解决 Uncaught TypeError: Cannot read properties of undefined (reading 'type') 报错,并实现实时绘制Echarts图。
<template>
<!--可视化图形 -->
<div>
<div id="chartline">
</div>
</div>
</template>
<script setup lang="ts">
import { onMounted, reactive, ref, markRaw,watch } from 'vue';
import { ElMessage } from 'element-plus';
import * as echarts from 'echarts'
const newdata = ref([120, 122, 111, 124, 110, 130, 136, 120, 130]);
const chartInstance: any = ref(null);
onMounted(() => {
// 封装 setOption 方法
const updateChart = () => {
chartInstance.value = markRaw(echarts.init( document.getElementById('chartline'))) ;
const option = {
dataZoom: {
type: 'inside',
startValue: 0,
endValue: 120
},
grid: {
top: '10%',
left: 'center',
width: '98%',
height: '90%',
containLabel: true,
},
toolbox: {
feature: {
saveAsImage: {
iconStyle: {
color: 'rgba(40, 242, 230, 1)',
}
},
// 自定义工具方法
myTooli: {
show: true,
title: '方法',
icon: 'path://M432.45,595.444c0,2.177-4.661,6.82-11.305,6.82c-6.475,0-11.306-4.567-11.306-6.82s4.852-6.812,11.306-6.812C427.841,588.632,432.452,593.191,432.45,595.444L432.45,595.444z M421.155,589.876c-3.009,0-5.448,2.495-5.448,5.572s2.439,5.572,5.448,5.572c3.01,0,5.449-2.495,5.449-5.572C426.604,592.371,424.165,589.876,421.155,589.876L421.155,589.876z M421.146,591.891c-1.916,0-3.47,1.589-3.47,3.549c0,1.959,1.554,3.548,3.47,3.548s3.469-1.589,3.469-3.548C424.614,593.479,423.062,591.891,421.146,591.891L421.146,591.891zM421.146,591.891',
onclick: function () {
newdata.value=[110, 112, 111, 114, 110, 110, 116, 110, 110];
// 手动更新 Echarts 图形
updateChart()
}
}
},
},
// 视觉映射
visualMap: {
show: false,
min: 50,
max: 140,
type: 'continuous',
color: ['rgba(255, 141, 26, 1)', 'rgba(67, 207, 124, 1)',]
},
xAxis: [
{
type: 'category',
boundaryGap: false,
splitLine: true,
data: ['00:00', '03:00', '06:00', '09:00', '12:00', '15:00', '18:00', '21:00', '24:00'],
},
{
axisLine: {
show: false,
},
type: 'value',
boundaryGap: false,
splitLine: {
show: false,
},
minorSplitLine: {
show: true,
lineStyle: {
opacity: 0.1
},
},
}
],
yAxis: {
axisLine: {
show: false,
},
splitLine: {
show: false
},
axisTick: {
show: false,
},
minorSplitLine: {
show: true,
lineStyle: {
opacity: 0.1
},
},
axisLabel: {
show: false,
},
type: 'value'
},
series: [
{
data: newdata?.value,
type: 'line',
symbol: 'none',
areaStyle: {},
smooth: true,
}
]
}
chartInstance.value.setOption(option, true)
}
// 初始化 Echarts 图形
updateChart()
})
</script>
<style scoped lang="less">
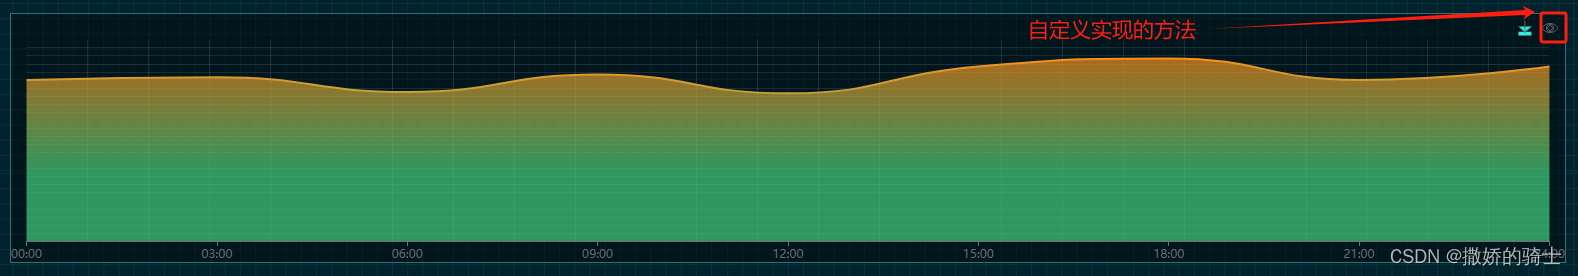
</style>实际效果图:


 4148
4148

 被折叠的 条评论
为什么被折叠?
被折叠的 条评论
为什么被折叠?
 到【灌水乐园】发言


