


目录
Elk文档 2
1 Logstash的部署 2
1.1版本号 2
1.2 Logstash部署 2
1.3 logstash(shipper)配置文件 3
1.4 logstash(indexer)配置文件 4
2 Redis的安装和使用 5
2.1版本号 5
2.2主从配置 5
3 ElasticSearch的安装和配置 5
3.1版本号 5
3.2 ElasticSearch集群配置 5
3.3 ElasticSearch配置文件 6
3.4 Elastcsearch常用插件 10
4 kibana安装配置 11
4.1版本号 11
4.2安装配置 11
4.3 kibana的配置文件 12
4.4 kibana使用 14
Elk文档
Elk(Elasticsearch、logstash、kinana),其中Logstash用于日志的收集;Elasticsearch用于日志的存储和搜索以及相应的统计分析;kibana用于日志数据的统计分析的实时展示,包含各种图表以及仪表盘的展示。整个Elk数据流的图形展示如下:
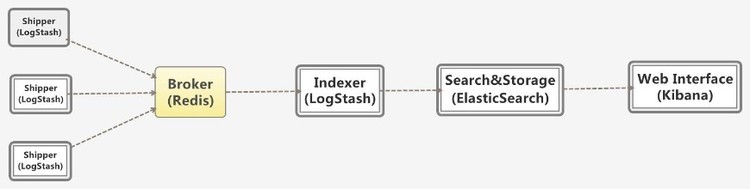
图表 1 数据流
1 Logstash的部署
Logstash用于日志的收集工作,并将收集上来的日志,传输到ES集群中,用于相应的日志存储以及统计分析。
1.1版本号
Logstash采用2.3.2的版本,现在官网可能会有更高的版本,其与1.x有很多的不同,而且ELK整体的部署需要版本的配套使用,因此建议寻找合适的版本,配套使用。
1.2 Logstash部署
第一步:Logstash的部署,请到官网下载:https://www.elastic.co/下载对应的版本例如:logstash-2.3.2.tar.gz,https://www.elastic.co/guide/en/logstash/current/introduction.html 是官网介绍logstash的使用文档。
第二步:将下载好的logstash-xx.tar.gz例如:logstash-2.3.2.tar.gz拷贝至相应的服务器上,例如:172.22.9.1上,路径:/home/hadoop/,将其解压即可,即其路径为:/home/Hadoop/logstash-2.3.2
第三步:进入到对应的路径,如上步所说的/home/Hadoop/logstash-2.3.2,新建conf文件,来存放相应的配置文件,然后新建一个配置文件,例如:input_gateway_outut_redis.conf(1.3节将会给出)。
例如其命令如下:
Cd /home/Hadoop/logstash-2.3.2
Mkdir conf
Cd conf
Touch input_gateway_outut_redis.conf
第四步:启动logstash,进入到bin所在一级的路径,输入启动命令:bin/logstash –f conf/配置文件名,如果需要后台启动,可以直接输入:nohup bin/logstash –f conf/配置文件名 & 命令。
例如:命令:
启动:bin/logstash –f conf/input_gateway_output_redis.conf
后台启动:nohup bin/logstash –f conf/input_gateway_output_redis.conf &
1.3 logstash(shipper)配置文件
在解压路径下的conf/下新建配置文件,文件名称可以任意以.conf结尾,最好文件名称易读。例如:input_gateway_output_redis.conf。文件配置内容分为输入:input{},filter{}输出:output{},三部分,其中input代表输入:要监控的文件,filter代表过滤,output代表输出。
例如:input_gateway_output_redis.con配置文件,内容如下:
input {
file {
type => “监控文件名”
path => [“监控文件路径名”]
codec => json {
charset => “UTF-8”
}
}
}
filter {
if [type] == “监控文件名” {
json {
source => “message”
target => “doc”
#remove_field => [“message”]
}
}
}
output {
redis {
host => “172.22.11.1” #redis server
port => 6380
data_type => “channel”
key => “logstash:redis”
}
}
其中,
input中:
Type:为对应索引库中的类型名称。
Path:为要收集日志文件所在的路径名,支持*号匹配模式。
Code:用于以UTF-8的格式来解析json。由于要监控的文件,每一行是以json的形式进行存储的
Output中:
Host:代表redis所在服务器的ip地址
Port:所使用的端口名称
Data_type:所使用的通道,可以是Channel也可以是list
1.4 logstash(indexer)配置文件
Logstash(indexer)负责不断的从队列中取出数据,并将其输送至Elasticsearch集群中。其可以和shipper在同一台机器上,也可以在不同的机器上。首先进入解压路径下的conf/下新建配置文件,文件名称可以任意以.conf结尾,最好文件名称易读。例如:input_redis_output_es.conf。文件配置内容分为输入:input{},filter{}输出:output{},三部分,其中input代表输入:要监控的文件,filter代表过滤,output代表输出。
例如:input_redis_output_es.conf配置文件,内容如下:
input {
redis {
host => “172.22.11.1”
port => “6380”
data_type => “channel”
key => “logstash:redis”
type => “redis-input”
}
}
output{
elasticsearch {
hosts => “172.22.9.3:9200”
index => “logstash-%{type}”
#document_type => “%{type}”
workers => 10
flush_size => 20000
idle_flush_time => 10
template_overwrite => true
}
}
其中:
Input中:
Host:代表redis所在服务器的ip地址
Port:所使用的端口名称
Data_type:所使用的通道,可以是Channel也可以是list
Output中:
Hosts:代表Elasticsearch所使用的ip地址及端口
Index:代表生成的索引库的名称。
Workers:所使用的线程数
Idle_flush_time:flushs所使用的时间间隔
2 Redis的安装和使用
Redis作为队列来使用,其安装和使用方式,与其他使用方式,这里仅仅是将其作为broker来使用。安装方式在这里做介绍。其ip(172.22.11.1)地址和开放端口(6380)要在1.3节中进行使用。
2.1版本号
Redis所使用的版本号是:2.8.20。
2.2主从配置
Redis使用了在两台服务器上,配置了主从配置,以保证数据的安全。
3 ElasticSearch的安装和配置
ElasticSearch作为日志数据的存储和搜索使用,配置成以集群的模式,当然也可以单独使用,可以有很多的插件供使用,帮助开发人员进行搜索,监控以及统计分析等。
3.1版本号
Elasticsearch所使用的版本号:2.3.3与logstah匹配。
3.2 ElasticSearch集群配置
第一步:ElasticSearch的部署,请到官网下载:https://www.elastic.co/下载对应的版本,例如:elasticsearch-2.3.3.tar.gz。可以从https://www.elastic.co/guide/en/elasticsearch/reference/current/index.html查看相应的使用文档。
第二步:将下载好的elasticsearch-2.3.3.tar.gz拷贝至相应的服务器上,例如:172.22.9.3上,路径:/home/hadoop/,将其解压即可,即其路径为:/home/Hadoop/elasticsearch-2.3.3
第三步:进入到对应的路径,如上步所说的/home/Hadoop/elasticsearch-2.3.3下,寻找config文件,修改里面的配置文件elasticsearch.yml和logging.yml文件(3.3节给出具体的修改方案).
第四步:启动Eelasticsearch,进入到解压路径,如/home/Hadoop/elasticsearch-2.3.3,输入启动命令:bin/elasticsearch 采用的就是默认的config下的配置文件。否则就要输入配置文件路径。后台启动采用nohup bin/elastcsearch & 命令。
3.3 ElasticSearch配置文件
1)、节点1的ElasticSearch.yml文件:
======================== Elasticsearch Configuration =========================
#
NOTE: Elasticsearch comes with reasonable defaults for most settings.
Before you set out to tweak and tune the configuration, make sure you
understand what are you trying to accomplish and the consequences.
#
The primary way of configuring a node is via this file. This template lists
the most important settings you may want to configure for a production cluster.
#
Please see the documentation for further information on configuration options:
http://www.elastic.co/guide/en/elasticsearch/reference/current/setup-configuration.html
#
———————————- Cluster ———————————–
#
Use a descriptive name for your cluster:
Es集群名称,同一局域网内,同一名称,es可以自动发现实例添加进来 cluster.name: 集群名称
#
———————————— Node ————————————
#
Use a descriptive name for the node:
该节点名称,可选,如果配置,就会自动生成一个字符串作为该节点名称 node.name: node-1
#
Add custom attributes to the node:
#
node.rack: r1
#
———————————– Paths ————————————
#
Path to directory where to store the data (separate multiple locations by comma):
存放数据的路径 path.data: /home/hadoop/elk/data
#
Path to log files:
存放日志数据路径 path.logs: /home/hadoop/elk/logs
#
———————————– Memory ———————————–
#
Lock the memory on startup:
这个最好打开,禁止内存交换,但需要root权限
bootstrap.mlockall: true
#
Make sure that the ES_HEAP_SIZE environment variable is set to about half the memory
available on the system and that the owner of the process is allowed to use this limit.
#
Elasticsearch performs poorly when the system is swapping the memory.
#
———————————- Network ———————————–
#
Set the bind address to a specific IP (IPv4 or IPv6):
该节点ip地址,以及发布出来的ip地址 network.host: 172.22.9.3
#
Set a custom port for HTTP:
该节点所使的http端口,端口号默认为9200 http.port: 9200
#
For more information, see the documentation at:
http://www.elastic.co/guide/en/elasticsearch/reference/current/modules-network.html
#
——————————— Discovery ———————————-
#
Pass an initial list of hosts to perform discovery when new node is started:
The default list of hosts is [“127.0.0.1”, “[::1]”]
当新节点启动的时候,将其ip地址加进来,可以构建集群通信 discovery.zen.ping.unicast.hosts: [“172.22.9.3”,”172.22.9.4”]
#
Prevent the “split brain” by configuring the majority of nodes (total number of nodes / 2 + 1):
#
discovery.zen.minimum_master_nodes: 3
#
For more information, see the documentation at:
http://www.elastic.co/guide/en/elasticsearch/reference/current/modules-discovery.html
#
———————————- Gateway ———————————–
#
Block initial recovery after a full cluster restart until N nodes are started:
#
gateway.recover_after_nodes: 3
#
For more information, see the documentation at:
http://www.elastic.co/guide/en/elasticsearch/reference/current/modules-gateway.html
#
———————————- Various ———————————–
#
Disable starting multiple nodes on a single system:
#
node.max_local_storage_nodes: 1
#
Require explicit names when deleting indices:
#
action.destructive_requires_name: true
2)、查看节点1是否启动成功 输入http://ip:端口号/ 有数据返回,则代表启动成功。例如:http://172.22.9.3:9200/ 如果有数据返回,则代表启动成功
3)、节点2的elastcsearch.yml配置文件
======================== Elasticsearch Configuration =========================
#
NOTE: Elasticsearch comes with reasonable defaults for most settings.
Before you set out to tweak and tune the configuration, make sure you
understand what are you trying to accomplish and the consequences.
#
The primary way of configuring a node is via this file. This template lists
the most important settings you may want to configure for a production cluster.
#
Please see the documentation for further information on configuration options:
http://www.elastic.co/guide/en/elasticsearch/reference/current/setup-configuration.html
#
———————————- Cluster ———————————–
#
Use a descriptive name for your cluster:
cluster.name: 集群名称
#
———————————— Node ————————————
#
Use a descriptive name for the node:
node.name: node-3
#
Add custom attributes to the node:
#
node.rack: r1
#
———————————– Paths ————————————
#
Path to directory where to store the data (separate multiple locations by comma):
path.data: /home/hadoop/elk/data
#
Path to log files:
path.logs: /home/hadoop/elk/logs
#
———————————– Memory ———————————–
#
Lock the memory on startup:
#
bootstrap.mlockall: true
#
Make sure that the ES_HEAP_SIZE environment variable is set to about half the memory
available on the system and that the owner of the process is allowed to use this limit.
#
Elasticsearch performs poorly when the system is swapping the memory.
#
———————————- Network ———————————–
#
Set the bind address to a specific IP (IPv4 or IPv6):
network.host: 172.22.9.4
#
Set a custom port for HTTP:
http.port: 9200
#
For more information, see the documentation at:
http://www.elastic.co/guide/en/elasticsearch/reference/current/modules-network.html
#
——————————— Discovery ———————————-
#
Pass an initial list of hosts to perform discovery when new node is started:
The default list of hosts is [“127.0.0.1”, “[::1]”]
discovery.zen.ping.unicast.hosts: [“172.22.9.3”,”172.22.9.4”]
#
Prevent the “split brain” by configuring the majority of nodes (total number of nodes / 2 + 1):
#
discovery.zen.minimum_master_nodes: 3
#
For more information, see the documentation at:
http://www.elastic.co/guide/en/elasticsearch/reference/current/modules-discovery.html
#
———————————- Gateway ———————————–
#
Block initial recovery after a full cluster restart until N nodes are started:
#
gateway.recover_after_nodes: 3
#
For more information, see the documentation at:
http://www.elastic.co/guide/en/elasticsearch/reference/current/modules-gateway.html
#
———————————- Various ———————————–
#
Disable starting multiple nodes on a single system:
#
node.max_local_storage_nodes: 1
#
Require explicit names when deleting indices:
#
action.destructive_requires_name: true
4)、查看节点2是否启动成功 输入http://ip:端口号/ 有数据返回,则代表启动成功。例如:http://172.22.9.4:9200/ 如果有数据返回,则代表启动成功
5)、待两个节点都启动成功,则会通过浏览器上输入:http://172.22.9.3:9200/_plugin/head/来查看整个集群的状况。
3.4 Elastcsearch常用插件
Elasticsearch常用的插件有很多都可以使用,这里只简单介绍常用的几种。
1)、head插件
在线安装:
如果服务器可以连网的话,可以在线安装,进入到elasticsearch的解压目录,bin目录所在一级,输入命令:bin/plugin -install mobz/elasticsearch-head。
离线安装:
第一步:https://github.com/mobz/elasticsearch-head下载zip 解压。
第二步:将解压后的elasticsearch-head-master文件夹下的文件copy到elasticserch-2.3.3/plugins/下,并将其重命名为head。
第三步:浏览器中输入:http://ip:端口号/_plugin/head/ 查看是否安装成功。
2)、sql插件
在线安装:
如果服务器可以连网的话,可以在线安装,进入到elasticsearch的解压目录,bin目录所在一级,输入命令:bin/plugin install https://github.com/NLPchina/elasticsearch-sql/releases/download/2.1.0/elasticsearch-sql-2.3.3.10.zip
也可以离线安装。
浏览器中输入:http://ip:端口号/_plugin/sql/ 查看是否安装成功。
4 kibana安装配置
kibana用于Elasticsearch数据统计分析结果的实时展示,首先通过请求Elastcisearh来获取其数据,然后通过在kibana上设置要统计分析的数据,使用图表得形式进行展示。
4.1版本号
Kibana所使用的版本是:kibana-4.x ,注意其有32位和64位之分。
4.2安装配置
第一步:ElasticSearch的部署,请到官网下载:https://www.elastic.co/下载对应的版本,例如:kibana-4.x.tar.gz。可以从https://www.elastic.co/guide/en/kibana/current/index.html查看相应的使用文档。
第二步:将下载好的kibana-4.x.tar.gz拷贝至相应的服务器上,例如:172.22.9.3上,路径:/home/hadoop/,将其解压即可,即其路径为:/home/Hadoop/kibana-4.x
第三步:进入到对应的路径,如上步所说的/home/Hadoop/kibana-4.x下,寻找config文件,修改里面的配置文件kibana.yml(4.3节给出具体的修改方案).
第四步:启动kibana,进入到解压路径,如/home/Hadoop/kibana-4.x,输入启动命令:bin/kibana 采用的就是默认的config下的配置文件。否则就要输入配置文件路径。后台启动采用nohup bin/kibana & 命令。
第五步:查看是否启动成功。http://ip:端口号/ 是否会出现相应的界面。例如:http://172.22.9.4:5601/
4.3 kibana的配置文件
1)、修改kibana.yml配置文件:
Kibana is served by a back end server. This controls which port to use.要使用得端口号
server.port: 5601
The host to bind the server to.服务器端的ip地址
server.host: “172.22.9.4”
If you are running kibana behind a proxy, and want to mount it at a path,
specify that path here. The basePath can’t end in a slash.
server.basePath: “”
The maximum payload size in bytes on incoming server requests.
server.maxPayloadBytes: 1048576
The Elasticsearch instance to use for all your queries.Elasticsearch所使用的ip:端口号
elasticsearch.url: “http://172.22.9.4:9200”
preserve_elasticsearch_host true will send the hostname specified in elasticsearch. If you set it to false,
then the host you use to connect to this Kibana instance will be sent.
elasticsearch.preserveHost: true
Kibana uses an index in Elasticsearch to store saved searches, visualizations
and dashboards. It will create a new index if it doesn’t already exist.
kibana.index: “.kibana”
The default application to load.
kibana.defaultAppId: “discover”
If your Elasticsearch is protected with basic auth, these are the user credentials
used by the Kibana server to perform maintenance on the kibana_index at startup. Your Kibana
users will still need to authenticate with Elasticsearch (which is proxied through
the Kibana server)
elasticsearch.username: “user”
elasticsearch.password: “pass”
SSL for outgoing requests from the Kibana Server to the browser (PEM formatted)
server.ssl.cert: /path/to/your/server.crt
server.ssl.key: /path/to/your/server.key
Optional setting to validate that your Elasticsearch backend uses the same key files (PEM formatted)
elasticsearch.ssl.cert: /path/to/your/client.crt
elasticsearch.ssl.key: /path/to/your/client.key
If you need to provide a CA certificate for your Elasticsearch instance, put
the path of the pem file here.
elasticsearch.ssl.ca: /path/to/your/CA.pem
Set to false to have a complete disregard for the validity of the SSL
certificate.
elasticsearch.ssl.verify: true
Time in milliseconds to wait for elasticsearch to respond to pings, defaults to
request_timeout setting
elasticsearch.pingTimeout: 1500
Time in milliseconds to wait for responses from the back end or elasticsearch.
This must be > 0
elasticsearch.requestTimeout: 30000
Time in milliseconds for Elasticsearch to wait for responses from shards.
Set to 0 to disable.
elasticsearch.shardTimeout: 0
Time in milliseconds to wait for Elasticsearch at Kibana startup before retrying
elasticsearch.startupTimeout: 5000
Set the path to where you would like the process id file to be created.
pid.file: /var/run/kibana.pid
If you would like to send the log output to a file you can set the path below.
logging.dest: stdout
Set this to true to suppress all logging output.
logging.silent: false
Set this to true to suppress all logging output except for error messages.
logging.quiet: false
Set this to true to log all events, including system usage information and all requests.
logging.verbose: false
2)、如有其他需要修改的,请参考官方文档。
4.4 kibana使用
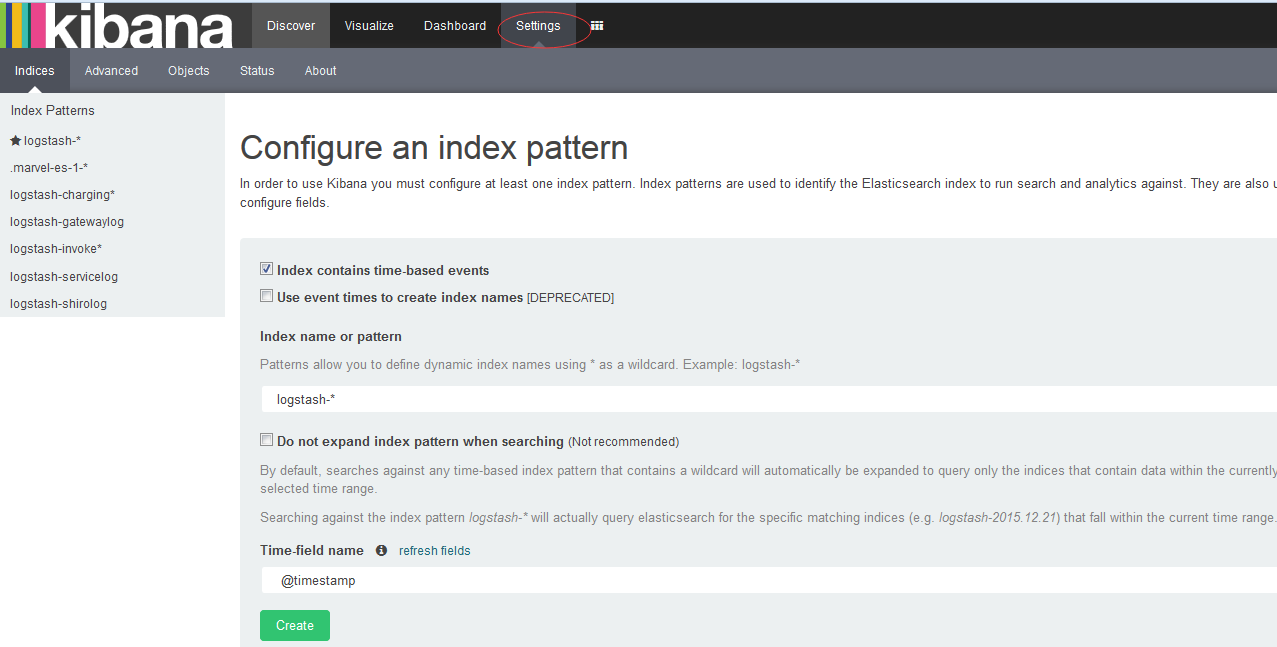
Kibana必须要选择相应Elastcisearch索引库,然后才能使用其中的所有数据。
1)、出现这个界面表示kibana启动成功,然后选择settings tab页,来选择你要使用得索引库。
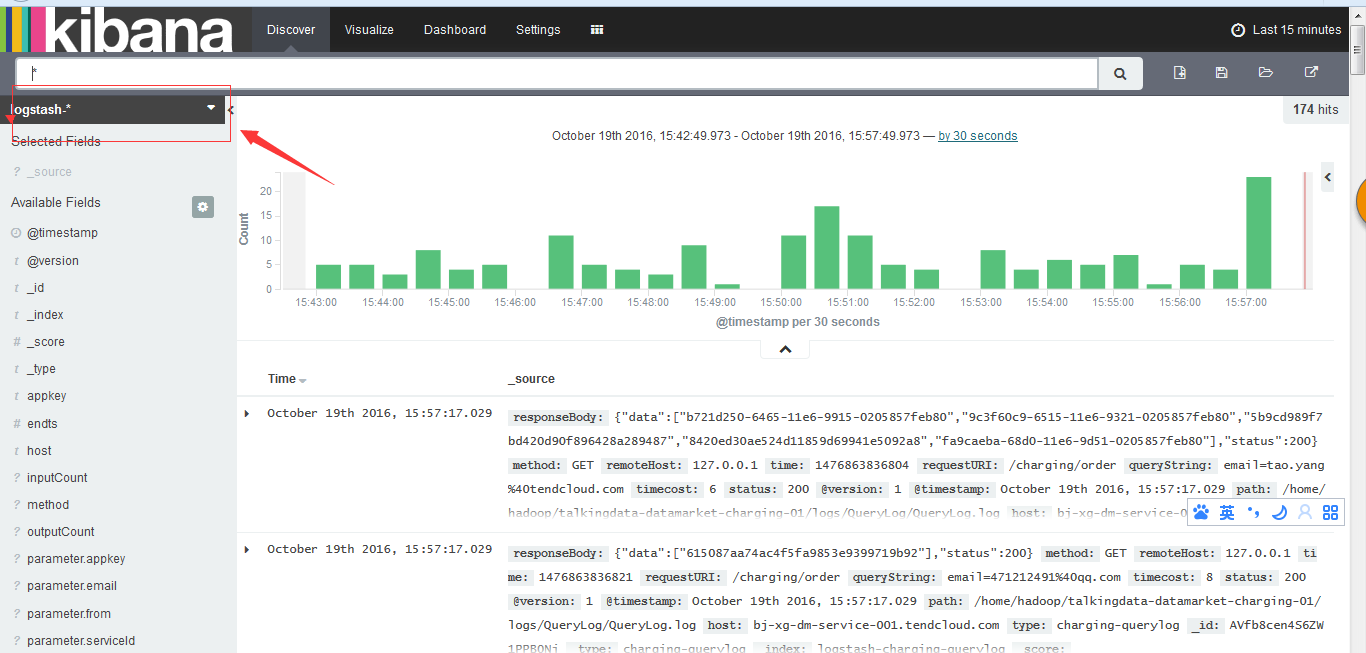
2)、点击Discover进入到一下界面,箭头所指的方向,出现你要使用得索引库名称。对应的图表为当前所选时间段内的数据进入情况。
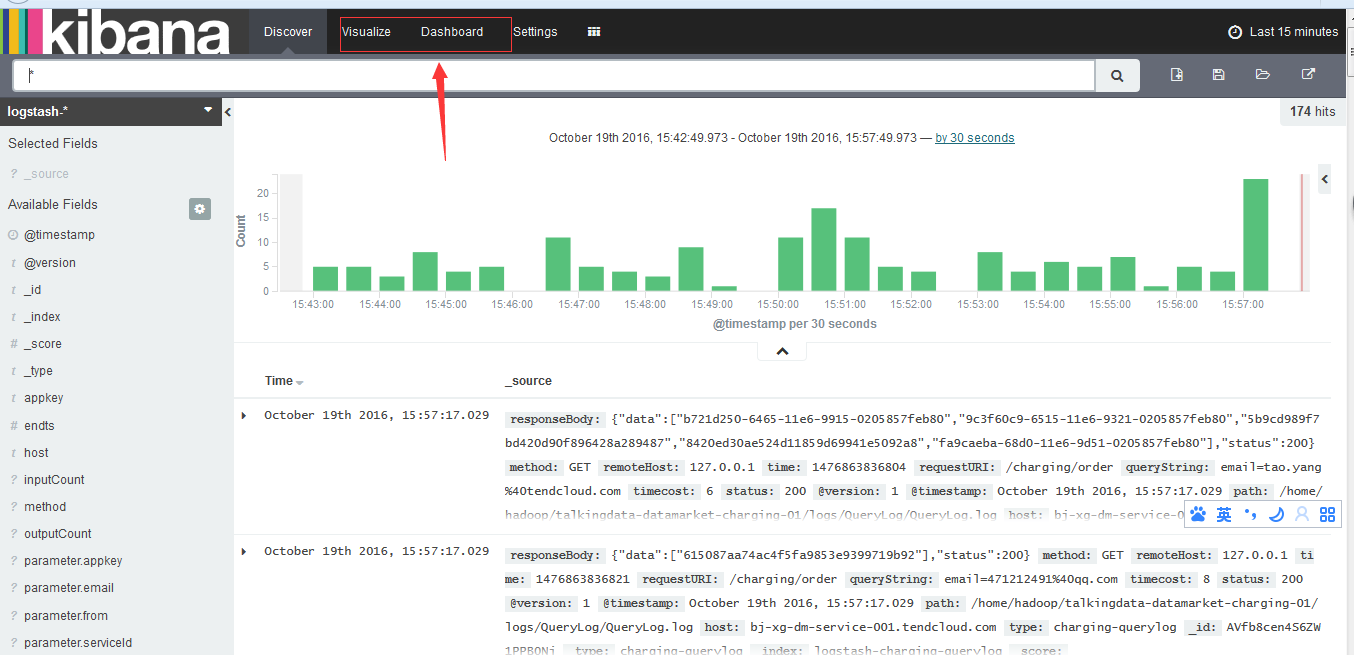
3)、visualise和Dashboard上用来对所选索引库中数据进行统计分析和图表展示的。右上角可以进行时间的选择。


 686
686

 被折叠的 条评论
为什么被折叠?
被折叠的 条评论
为什么被折叠?
 到【灌水乐园】发言


