


《老饼讲解机器学习》![]() https://www.bbbdata.com/text/35
https://www.bbbdata.com/text/35
目录
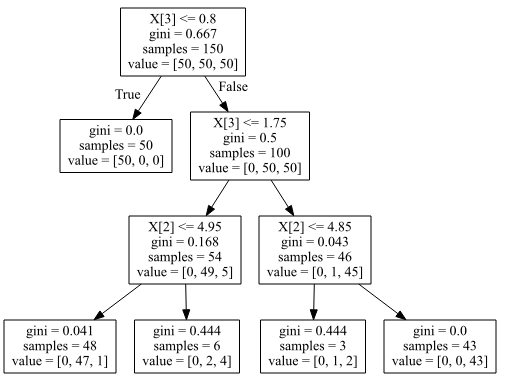
用sklearn建好决策树后,可以打印出树的结构:

但往往我们提取图中的数据(例如用于将决策树转化成规则代码),那图中的数据究竟在哪呢?
本文讲述如何在sklearn训练好决策树后,提取决策树中的数据。
一.决策树数据提取代码
决策树的结构主要由如下代码提取:
左节点编号 : clf.tree_.children_left
右节点编号 : clf.tree_.children_right
分割的变量 : clf.tree_.feature
分割的阈值 : clf.tree_.threshold
不纯度(gini) : clf.tree_.impurity
样本个数 : clf.tree_.n_node_samples
样本分布 : clf.tree_.value
二. 例子解说
直接用例子说明
代码:
# -*- coding: utf-8 -*-
from sklearn.datasets import load_iris
from sklearn import tree
import graphviz
#----------------数据准备----------------------------
iris = load_iris()                          # 加载数据
#---------------模型训练---------------------------------
clf = tree.DecisionTreeClassifier(random_state=0,max_depth=3)
clf = clf.fit(iris.data, iris.target)
#---------------树结构可视化-----------------------------
dot_data = tree.export_graphviz(clf)
graph = graphviz.Source(dot_data)
graph                                    # 需要独立运行
#---------------提取模型结构数据--------------------------
children_left    = clf.tree_.children_left            # 左节点编号
children_right   = clf.tree_.children_right            # 右节点编号
feature        = clf.tree_.feature               # 分割的变量
threshold       = clf.tree_.threshold              # 分割阈值
impurity       = clf.tree_.impurity               # 不纯度(gini)
n_node_samples   = clf.tree_.n_node_samples            # 样本个数
value         = clf.tree_.value                 # 样本分布

#-------------打印------------------------------
print("children_left:",children_left)
print("children_right:",children_right)
print("feature:",feature)
print("threshold:",threshold)
print("impurity:",impurity)
print("n_node_samples:",n_node_samples)
print("value:",value)
运行结果:
children_left : [ 1 -1  3  4 -1 -1  7 -1 -1]
children_right: [ 2 -1  6  5 -1 -1  8 -1 -1]
feature       : [ 3 -2 3 2 -2 -2 2 -2 -2]
threshold     : [ 0.80000001 -2.  1.75   4.95000005 -2.   -2.  4.85000014 -2.   -2.]
impurity      : [0.66666667 0.  0.5   0.16803841 0.04079861 0.44444444 0.04253308 0.44444444 0.  ]
n_node_samples: [150 50 100 54 48  6 46  3 43]
value : [[[50. 50. 50.]][[50. 0. 0.]] [[ 0. 50. 50.]] [[ 0. 49. 5.]] [[ 0. 47. 1.]] [[ 0. 2. 4.]] [[ 0. 1. 45.]] [[ 0. 1. 2.]] [[ 0. 0. 43.]]]1.提取树结构
树结构主要靠children_left和children_right ,它们记录了左右节点编号
children_left[0] 代表 第0(根节点)个节点的左节点编号为1,同理,右节点编号为 children_right[0] = 2,
左节点1和节点2的子节点去哪找呢,直接代入 children_left和 children_right即可:
左节点1的子节点编号: 左子节点 children_left[1] = -1,右子节点children_right[1] =-1, -1代表没有子节点(即叶子节点)。
右节点2的子节点编号: 左子节点 children_left[2] = 3,右子节点children_right[2] = 6 。
....
如此类推,即知树结构。
备注: 借助图与输出值对比,比较容易理解
2.提取节点信息
第0个节点的信息:
分割变量 :feature[0] = 3
分割阈值 :threshold[0] =0.8
不纯度(gini系数) :impurity[0] = 0.66666667
样本个数 :n_node_samples[0] = 150
样本分布 :value[0] = [50 50 50]第1个节点的信息:
分割变量 :feature[1]= -2 (叶子节点,该值没意义)
分割阈值 :threshold[1] = -2 (叶子节点,该值没意义)
不纯度(gini系数) :impurity[1]= 0
样本个数 :n_node_samples[1] = 50
样本分布 :value[1]= [50 0 0]
......
......
如此类推即可。
备注:sklearn并没有直接存决策树的类别(概率)预测值,我们需要借助 样本分布value:样本最多的一类即预测类,样本占比即预测概率。
相关文章


 3383
3383


 被折叠的 条评论
为什么被折叠?
被折叠的 条评论
为什么被折叠?
 到【灌水乐园】发言


