


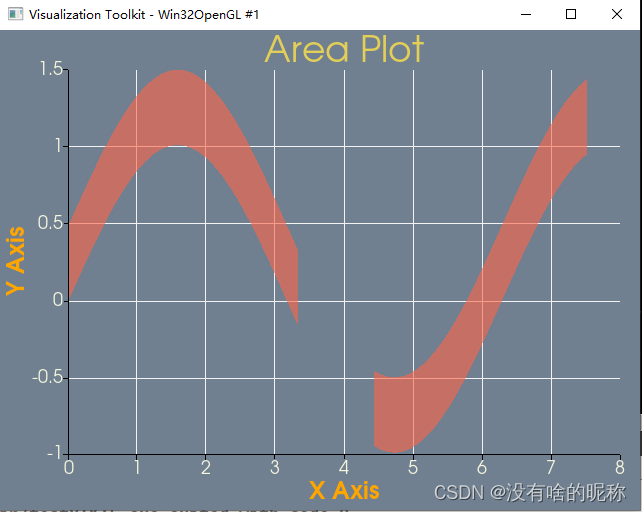
这个例子演示了vtkPlotArea,它在两条曲线之间绘制填充区域。该示例使用有效的掩码来选择定义要绘制的区域的值。
该示例还展示了如何控制情节组件的大小和颜色。
运行效果
#include <vtkNew.h>
#include <vtkPlotArea.h>
#include <vtkNamedColors.h>
#include <vtkAxis.h>
#include <vtkBrush.h>
#include <vtkCharArray.h>
#include <vtkChartXY.h>
#include <vtkContextScene.h>
#include <vtkContextView.h>
#include <vtkFloatArray.h>
#include <vtkNew.h>
#include <vtkPlot.h>
#include <vtkRenderWindow.h>
#include <vtkRenderWindowInteractor.h>
#include <vtkRenderer.h>
#include <vtkTable.h>
#include <vtkTextProperty.h>
#include <algorithm>
//----------------------------------------------------------------------------
#include <vtkAutoInit.h>
VTK_MODULE_INIT(vtkRenderingOpenGL2);
VTK_MODULE_INIT(vtkInteractionStyle);
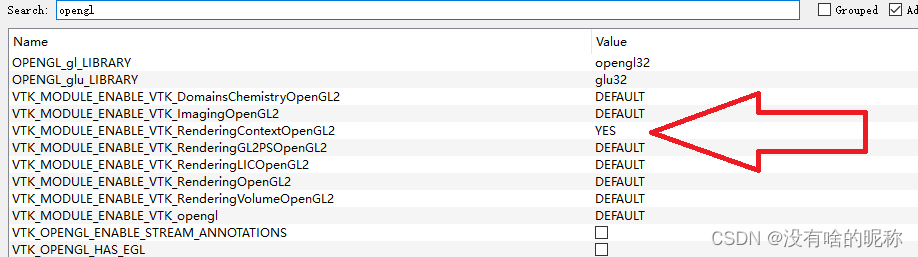
VTK_MODULE_INIT(vtkRenderingContextOpenGL2); //这里编译时选择的是default,要改成yes
int main(int, char*[])
{
vtkNew<vtkNamedColors> colors;
// Set up a 2D scene, add an XY chart to it
vtkNew<vtkContextView> view;
view->GetRenderWindow()->SetSize(640, 480);
view->GetRenderWindow()->SetWindowName("AreaPlot");
vtkNew<vtkChartXY> chart;
chart->SetTitle("Area Plot");
chart->GetTitleProperties()->SetFontSize(36);
chart->GetTitleProperties()->SetColor(colors->GetColor3d("Banana").GetData());
chart->GetAxis(0)->GetTitleProperties()->SetFontSize(24);
chart->GetAxis(0)->GetTitleProperties()->SetColor(
colors->GetColor3d("orange").GetData());
chart->GetAxis(0)->GetLabelProperties()->SetColor(
colors->GetColor3d("beige").GetData());
chart->GetAxis(0)->GetLabelProperties()->SetFontSize(18);
chart->GetAxis(1)->GetTitleProperties()->SetFontSize(24);
chart->GetAxis(1)->GetTitleProperties()->SetColor(
colors->GetColor3d("orange").GetData());
chart->GetAxis(1)->GetLabelProperties()->SetColor(
colors->GetColor3d("beige").GetData());
chart->GetAxis(1)->GetLabelProperties()->SetFontSize(18);
view->GetScene()->AddItem(chart);
// Create a table with some points in it...
vtkNew<vtkTable> table;
vtkNew<vtkFloatArray> arrX;
arrX->SetName("X Axis");
table->AddColumn(arrX);
vtkNew<vtkFloatArray> arrC;
arrC->SetName("Cosine");
table->AddColumn(arrC);
vtkNew<vtkFloatArray> arrS;
arrS->SetName("Sine");
table->AddColumn(arrS);
vtkNew<vtkFloatArray> arrS2;
arrS2->SetName("Sine2");
table->AddColumn(arrS2);
vtkNew<vtkFloatArray> arrS3;
arrS3->SetName("Sine3");
table->AddColumn(arrS3);
vtkNew<vtkFloatArray> arr1;
arr1->SetName("One");
table->AddColumn(arr1);
vtkNew<vtkCharArray> validMask;
validMask->SetName("ValidMask");
table->AddColumn(validMask);
// Test charting with a few more points...
int numPoints = 69;
float inc = 7.5 / (numPoints - 1);
table->SetNumberOfRows(numPoints);
for (int i = 0; i < numPoints; ++i)
{
table->SetValue(i, 0, i * inc + 0.01);
table->SetValue(i, 1, cos(i * inc) + 0.01);
table->SetValue(i, 2, sin(i * inc) + 0.01);
table->SetValue(i, 3, sin(i * inc) + 0.5);
table->SetValue(i, 4, sin(i * inc) * sin(i * inc) + 0.01);
table->SetValue(i, 5, 1.0);
validMask->SetValue(i, (i > 30 && i < 40) ? 0 : 1); //这里是设置掩码值的地方
}
// Add multiple line plots, setting the colors etc
vtkColor3d color3d = colors->GetColor3d("tomato");
vtkPlotArea* area =
dynamic_cast<vtkPlotArea*>(chart->AddPlot(vtkChart::AREA));
area->SetInputData(table);
area->SetInputArray(0, "X Axis");
area->SetInputArray(1, "Sine");
area->SetInputArray(2, "Sine2");
area->SetValidPointMaskName("ValidMask");
area->GetBrush()->SetColorF(color3d.GetRed(), color3d.GetGreen(),
color3d.GetBlue(), .6);
chart->GetAxis(vtkAxis::LEFT)->SetLogScale(true);
// Render the scene and compare the image to a reference image
view->GetRenderer()->SetBackground(colors->GetColor3d("SlateGray").GetData());
view->GetRenderWindow()->SetMultiSamples(0);
view->GetRenderWindow()->Render();
view->GetInteractor()->Initialize();
view->GetInteractor()->Start();
return EXIT_SUCCESS;
}其中VTK9.0.1默认不编译RenderingContextOpenGL2这个库,需要重新选择,然后编译一下。


 584
584

 被折叠的 条评论
为什么被折叠?
被折叠的 条评论
为什么被折叠?
 到【灌水乐园】发言


