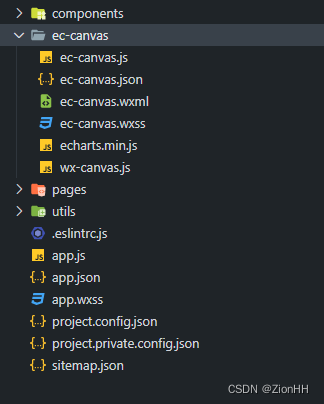
- 下载echarts-for-weixin小程序组件,将
ec-canvas文件夹放到小程序项目中
- 创建echarts组件
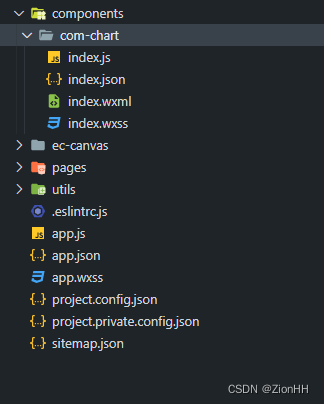
组件代码
<view style="height: {{height}}">
<ec-canvas id="{{chartId}}" canvas-id="{{canvasId}}" ec="{{ ec }}"></ec-canvas>
</view>
import * as echarts from '../../ec-canvas/echarts.min'
Component({
properties: {
height: {
type: String
},
option: {
type: Object,
observer(val) {
if (Object.keys(val).length) {
this.initChart(val)
}
}
}
},
data: {
chartId: '',
canvasId: '',
ec: {
lazyload: true
}
},
lifetimes: {
attached() {
this.setData({
chartId: `chart_${this.__wxExparserNodeId__}`,
canvasId: `canvas_${this.__wxExparserNodeId__}`
})
this.chart = this.selectComponent('#' + this.data.chartId)
}
},
methods: {
initChart(option) {
this.chart.init((canvas, width, height, dpr) => {
const chart = echarts.init(canvas, null, {
width: width,
height: height,
devicePixelRatio: dpr
})
chart.setOption(option)
this.chart = chart
return chart
})
}
}
})
{
  "component": true,
  "usingComponents": {
    "ec-canvas": "../../ec-canvas/ec-canvas"
  }
}
- 页面引用
{
  "usingComponents": {
    "com-chart": "../../components/com-chart/index"
  }
}
<view>
  <com-chart option="{{option}}" height="400rpx"></com-chart>
</view>
Page({
  data: {
    option: {}
  },
  onLoad() {
    setTimeout(() => {
      this.setData({
        option: {
          backgroundColor: "#ffffff",
          series: [{
            label: {
              normal: {
                fontSize: 14
              }
            },
            type: 'pie',
            center: ['50%', '50%'],
            radius: ['20%', '40%'],
            data: [{
              value: 55,
              name: '北京'
            }, {
              value: 20,
              name: '武汉'
            }, {
              value: 10,
              name: '杭州'
            }, {
              value: 20,
              name: '广州'
            }, {
              value: 38,
              name: '上海'
            }]
          }]
        }
      })
    }, 500)
  }
})


 833
833


 被折叠的 条评论
为什么被折叠?
被折叠的 条评论
为什么被折叠?
 到【灌水乐园】发言


