


今天遇到一个复杂的画图任务
先看最终效果图
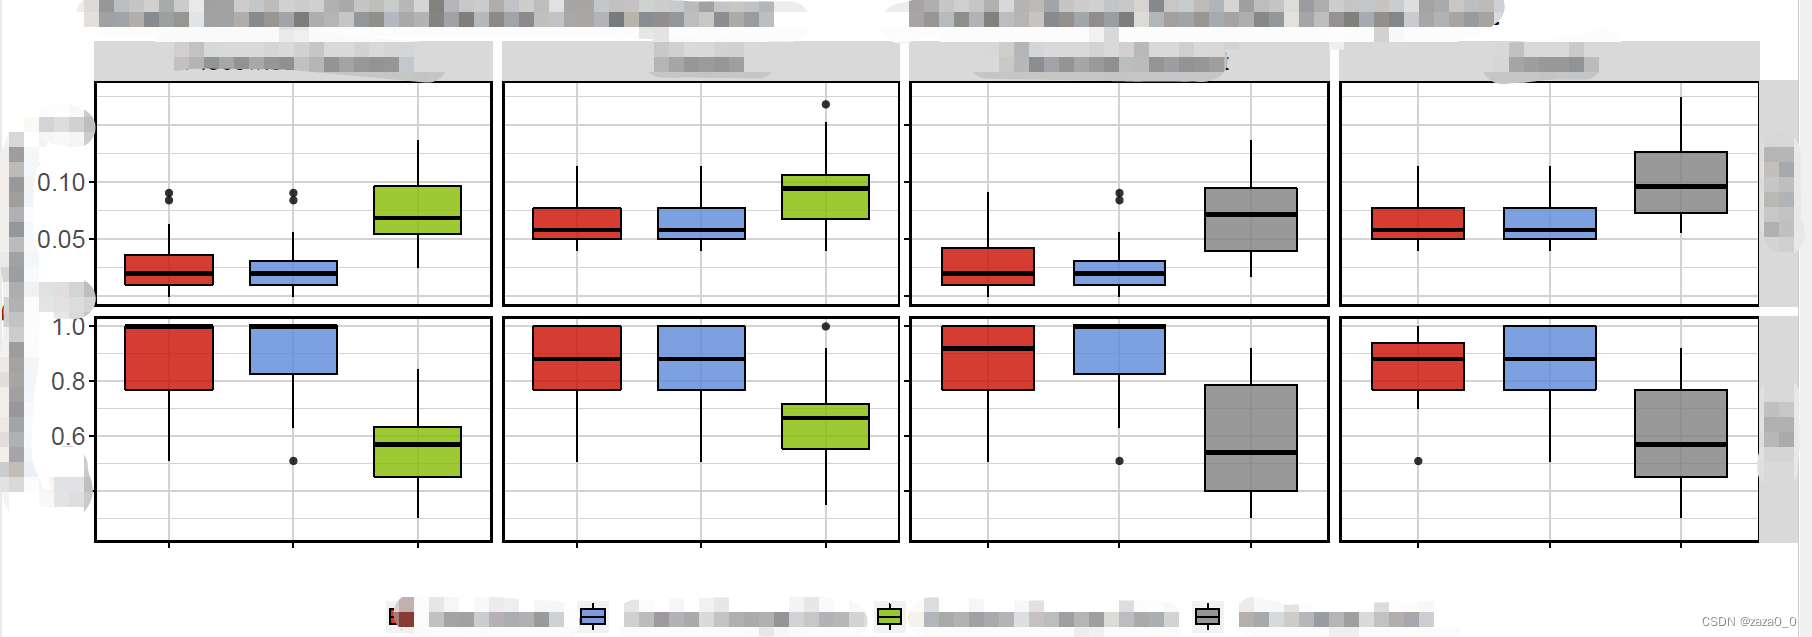
其实这是左右两张ggplot合并的结果。注意两张图有两个共有水平(红色,蓝色),但每个图不完全包含全部四个水平。最后legend出要有全部4个水平。
如果使用简单的facet_grid,结果如下
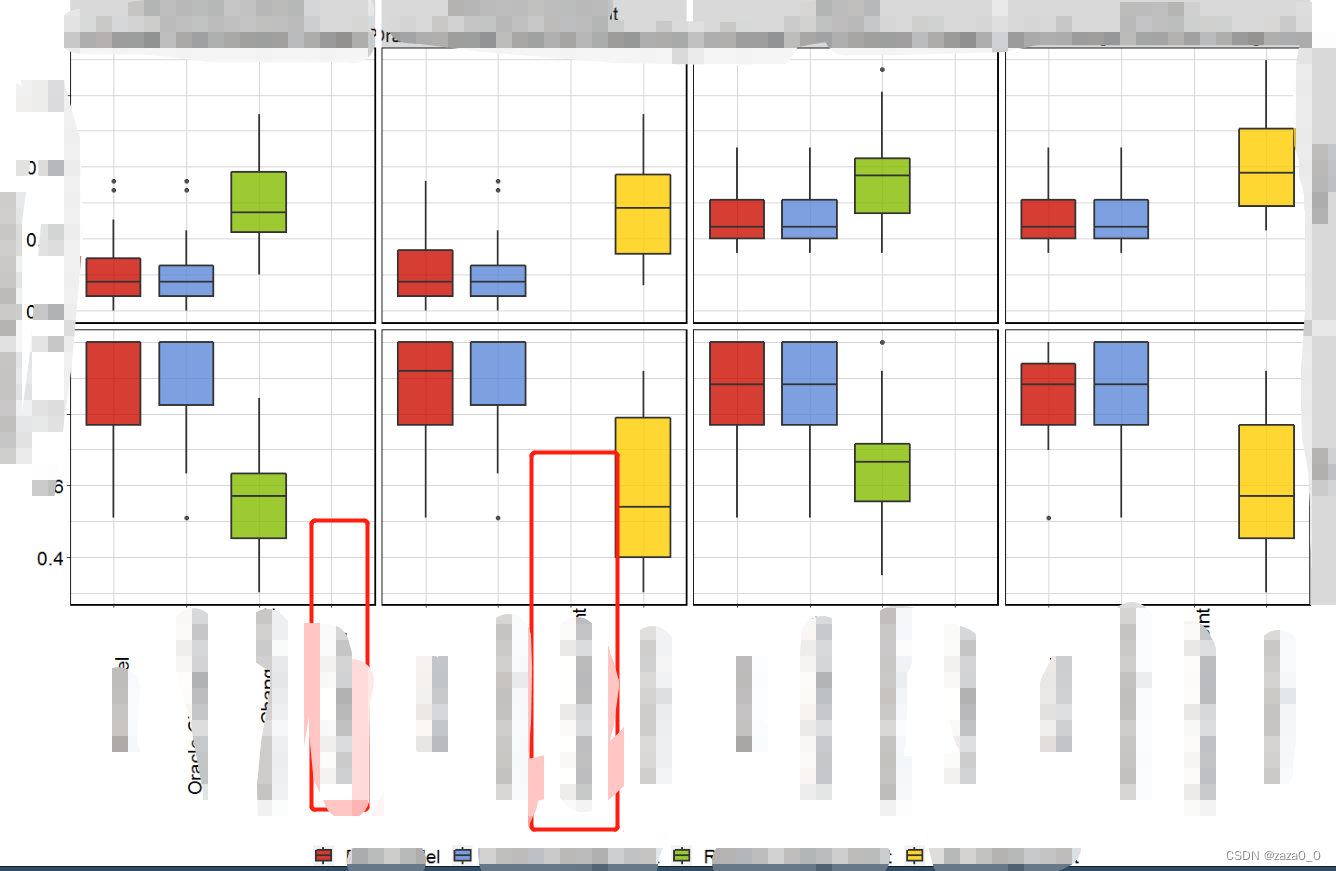
每张图会余留一个空缺位置,达不到想要的效果。核心思路是画两个ggplot,再用ggarrange合并。需要注意的是,本人很久没用R了,不知道是ggplot2更新了思路了还是咋的,用p<- ggplot(…) + geom_box(…)一直不能成功,只有用ggboxplot(…)才能成功。下面介绍具体方法
第一步获取公共legend
在这一步就简单把所有水平都一起画个图,然后调整legend到自己想要的样子,之后ggarrange会直接把legend部分抠图粘贴上去。
library(ggpubr)
dat_cp_1 =fread('icmodel_2022-11-02method(25)N50_1d.csv')
dat_cp_2 =fread('icmodel_2022-11-02method(23)N50_1d.csv')

dat_cp_1$init <- factor(dat_cp_1$init, levels = c('best_model', 'true_change_points','random_cp_K2'),
                        labels = c('Best Model', 'Oracle Change Point', 'Random Change Point'))
dat_cp_2$init <- factor(dat_cp_2$init, levels = c('best_model', 'true_change_points','no_change_points'),
                        labels = c('Best Model', 'Oracle Change Point', 'No Change Point'))
dat_cp = rbind(dat_cp_1, dat_cp_2)
dat_cp$Setting <- factor(dat_cp$Setting,levels = c('pwconst2', 'smooth'),
                         labels = c('Piecewise Constant', 'Smooth'))
dat_cp$compare = rep(c('setting1', 'setting2'), each = dim(dat_cp_1)[1])
dat_cp_processed <- gather(dat_cp, metric, value, -c('Setting', 'seed', 'init','compare'))
dat_cp_processed$metric=factor(dat_cp_processed$metric, levels = c('cp_err', 'ARI'),
                               labels =  c('CP Error', 'ARI'))
cbPalette=c('#cc0c00', '#5c88da','#84bd00', '#ffcc00', '#7c878e','#00b5e2','#00af66',"#E69F00","#660099")

p2 = ggboxplot(dat_cp_processed, x='init', y='value', fill='init',alpha=0.8,
               palette = my_colors[1:4],labs='g',
               ggtheme = theme(
                 # legend.direction="vertical",
                 legend.title = ,
                 legend.position = "bottom",
                 # panel.border=element_blank(),
                 # legend.box.spacing=0.4,
                 panel.border = element_rect(color = "black", fill = NA, size = 1),
                 # axis.line=element_line(size=1, colour="black"),
                 panel.grid.major=element_line(colour="#d3d3d3"),
                 panel.grid.minor=element_line(colour="#d3d3d3"),
                 panel.background=element_blank(),
                 plot.title=element_text(size=18, face="bold"),
                 text=element_text(size=18),
                 # axis.text.x = element_blank(),
                 axis.text.x=element_text(colour="black", size=0, angle = 0),
                 strip.text.y = element_blank(),
                 axis.text.y=element_text(colour="black", size=16),
                 plot.margin=grid::unit(c(0.3,0,40,0), "mm")
               )
               )
p2
p2=ggpar(p2, legend.title = "")
第二步 画两个图
要注意想要实现拼接效果,左边图不要有facet的axis.text.y, 右边图不要有左边的ylab和刻度,x刻度是否需要根据空间决定。
一个关键的点是要统一两边刻度,就需要自己给定,感谢网友的代码:
#' Scale individual facet y-axes
#'
#'
#' VERY hacky method of imposing facet specific y-axis limits on plots made with facet_wrap
#' Briefly, this function alters an internal function within the ggproto object, a function which is called to find any limits imposed on the axes of the plot.
#' We wrap that function in a function of our own, one which intercepts the return value and modifies it with the axis limits we've specified the parent call
#'
#' I MAKE NO CLAIMS TO THE STABILITY OF THIS FUNCTION
#'
#'
#' @param plot The ggproto object to be modified
#' @param ylims A list of tuples specifying the y-axis limits of the individual facets of the plot. A NULL value in place of a tuple will indicate that the plot should draw that facet as normal (i.e. no axis modification)
#'
#' @return The original plot, with facet y-axes modified as specified
#' @export
#'
#' @examples
#' Not intended to be added to a ggproto call list.
#' This is a standalone function which accepts a ggproto object and modifies it directly, e.g.
#'
#' YES. GOOD:
#' ======================================
#' plot = ggplot(data, aes(...)) +
#'   geom_whatever() +
#'   geom_thing()
#'
#' scale_individual_facet_y_axes(plot, ylims)
#' ======================================
#'
#' NO. BAD:
#' ======================================
#' ggplot(data, aes(...)) +
#'   geom_whatever() +
#'   geom_thing() +
#'   scale_individual_facet_y_axes(ylims)
#' ======================================
#'
scale_inidividual_facet_y_axes = function(plot, ylims) {
  init_scales_orig = plot$facet$init_scales

  init_scales_new = function(...) {
    r = init_scales_orig(...)
    # Extract the Y Scale Limits
    y = r$y
    # If this is not the y axis, then return the original values
    if(is.null(y)) return(r)
    # If these are the y axis limits, then we iterate over them, replacing them as specified by our ylims parameter
    for (i in seq(1, length(y))) {
      ylim = ylims[[i]]
      if(!is.null(ylim)) {
        y[[i]]$limits = ylim
      }
    }
    # Now we reattach the modified Y axis limit list to the original return object
    r$y = y
    return(r)
  }

  plot$facet$init_scales = init_scales_new

  return(plot)
}
具体使用方法如下,主要要用ggboxplot不能用ggplot()+geom_box才能成功
ylims = list(c(0, 0.18),c(0.25,1), c(0, 0.20),NULL)

p_cp1 <- ggboxplot(dat_cp_processed[dat_cp_processed$compare == "setting1",],
                 x = "init", y = "value",alpha=0.8,xlab = FALSE, ylab = "Estimation Performance",
                 fill = "init", palette = my_colors[1:3],title = "Oracle Change Point+Random Change Point",
                 facet.by =c('metric','Setting'), scales = 'free_y',
                 ggtheme = theme(
                   # legend.direction="vertical",
                   legend.position = "None",
                   # panel.border=element_blank(),
                   # legend.box.spacing=0.4,
                   panel.border = element_rect(color = "black", fill = NA, size = 1),
                   # axis.line=element_line(size=1, colour="black"),
                   panel.grid.major=element_line(colour="#d3d3d3"),
                   panel.grid.minor=element_line(colour="#d3d3d3"),
                   panel.background=element_blank(),
                   plot.title=element_text(size=18, face="bold"),
                   text=element_text(size=18),
                   # axis.text.x = element_blank(),
                   axis.text.x=element_text(colour="white", size=0, angle = 0),
                   strip.text.y = element_blank(),
                   # axis.text.y=element_text(colour="black", size=16),
                   plot.margin=grid::unit(c(0.3,0,8,0), "mm")
                 )
                 )


scale_inidividual_facet_y_axes(p_cp1, ylims = ylims)
p_cp1


# bxp+scale_fill_manual(values=cbPalette[c(1,2,5)])
# Dot plot
p_cp2 <- ggboxplot(dat_cp_processed[dat_cp_processed$compare == "setting2",],
                x = "init", y = "value", alpha=0.8,ylab=0, xlab = 0,title = "Oracle Change Point+No Change Point",
                fill = "init", palette = my_colors[c(1,2,4)],
                facet.by =c('metric','Setting'),scales = 'free',
                ggtheme = theme(
                  # legend.direction="vertical",
                  legend.position = "None",
                  # panel.border=element_blank(),
                  # legend.box.spacing=0.4,
                  panel.border = element_rect(color = "black", fill = NA, size = 1),
                  # axis.line=element_line(size=1, colour="black"),
                  panel.grid.major=element_line(colour="#d3d3d3"),
                  panel.grid.minor=element_line(colour="#d3d3d3"),
                  panel.background=element_blank(),
                  plot.title=element_text(size=18, face="bold"),
                  text=element_text(size=18),
                  # axis.text.x = element_blank(),
                  axis.text.x=element_text(colour="white", size=0, angle = 0),
                  # strip.text.y = element_blank(),
                  axis.text.y=element_text(colour="white", size=0),
                  plot.margin=grid::unit(c(0.3,0,8,0), "mm")
                ))
p_cp2
scale_inidividual_facet_y_axes(p_cp2, ylims = ylims)
最后一步合并
注意设定ledend.grob=get_legend(p2)
ggarrange(p_cp1, p_cp2, ncol = 2, common.legend = 1,
          legend.grob = get_legend(p2), legend = 'bottom')
大功告成!


 1448
1448


 被折叠的 条评论
为什么被折叠?
被折叠的 条评论
为什么被折叠?
 到【灌水乐园】发言


