X6 给了无限可能,玩转图形化
节点之间的边上增加一个滑动小球容易,可是效果不理想,滑动不丝滑。利用path实现短线滑动,像一辆小车跑在轨道上。注意不要用渐变颜色,否则可能部分路线不显示,其实没有消失,只是颜色插值问题。
全部代码,保证运行
<!DOCTYPE html>
<html lang="en">
<head>
    <meta charset="UTF-8">
    <title>Comet Edge in X6</title>
    <script src="https://unpkg.com/@antv/x6@2"></script>
    <style>
        #container {
            width: 800px;
            height: 600px;
            border: 1px solid #000;
            display: block;
            margin: auto;
            background-color: #f0f0f0;
        }
    </style>
</head>
<body>


<svg width="400" height="200" style="background:black">
	<svg width="200" height="200">
  <defs>
    <linearGradient id="lineGradient" x1="0%" y1="0%" x2="0%" y2="100%">
      <stop offset="0%" style="stop-color:rgb(255,255,255);stop-opacity:1" />
      <stop offset="100%" style="stop-color:rgb(11,222,15);stop-opacity:1" />
    </linearGradient>
  </defs>
  <path d="M 100.01 50 L 100 60" stroke="url(#lineGradient)" stroke-width="1" fill="none"/>


	<path d="M 200 50 V 150 Z" stroke="url(#lineGradient)" fill="none"/>
</svg>

<div id="container" style="background:#190a1a;"></div>

<script>
document.addEventListener('DOMContentLoaded', function() {
    const { Graph } = X6;

    const graph = new Graph({
        container: document.getElementById('container'),
        width: 1900,
        height: 1200,
		background:'#890fea'
    });

  // 在SVG的<defs>部分添加渐变定义
    const svg = graph.view.svg;
    const defs = document.createElementNS('http://www.w3.org/2000/svg', 'defs');
    const linearGradient = document.createElementNS('http://www.w3.org/2000/svg', 'linearGradient');
    linearGradient.setAttribute('id', 'cometGradient');
    linearGradient.innerHTML = `
		<stop offset="0%" stop-color="rgb(11,222,15)" />
		<stop offset="50%" stop-color="rgb(255,255,255)" />
        <stop offset="100%" stop-color="rgb(11,222,15)"/>
    `;
	 const linearGradient2 = document.createElementNS('http://www.w3.org/2000/svg', 'linearGradient');
    linearGradient.setAttribute('id', 'redCometGradient');
    linearGradient.innerHTML = `
		<stop offset="0%" stop-color="rgb(221,12,15)" />
		<stop offset="50%" stop-color="rgb(255,255,255)" />
        <stop offset="100%" stop-color="rgb(211,12,15)"/>
    `;
    defs.appendChild(linearGradient);
    svg.appendChild(defs);


    // 注册自定义边
    Graph.registerEdge('cometEdge', {
        markup: [
            {
                tagName: 'path',
                selector: 'line',
            },
            {
                tagName: 'path',
                selector: 'shortLine',
            },
			/**{
			  tagName: 'polygon',
			  selector: 'polygon',
			},*/
        ],
        attrs: {
            line: {
				stroke: 'green',//1890FF
				strokeWidth: 2,
				connection:true,
				fill:'none',
			},
            shortLine: {
				fill: 'none',
				stroke: 'rgba(11,255,11,0.9)',//'url(#cometGradient)',
				strokeWidth: 2,
				strokeLinecap: 'round',
				d:'M 0 0 L 0 0 Z',

			},
        },
    }, true);
	 // 添加节点
    const source = graph.addNode({
        shape: 'circle',
        x: 40,
        y: 40,
        width: 60,
        height: 60,
        attrs: {
            body: {
                fill: '#2ECC71',
                stroke: '#000',
            },
            label: {
                text: 'Start',
                fill: '#333',
            },
        },
    });

    const target = graph.addNode({
        shape: 'circle',
        x: 100,
        y: 140,
        width: 60,
        height: 60,
        attrs: {
            body: {
                fill: '#F39C12',
                stroke: '#000',
            },
            label: {
                text: 'End1',
                fill: '#333',
            },
        },
    });

	 const target2 = graph.addNode({
		shape: 'circle',
		x: 340,
		y: 40,
		width: 60,
		height: 60,
		attrs: {
			body: {
				fill: '#F39C12',
				stroke: '#000',
			},
			label: {
				text: 'End2',
				fill: '#333',
			},
		},
	});

	 const target3 = graph.addNode({
		shape: 'circle',
		x: 500,
		y: 50,
		width: 60,
		height: 60,
		attrs: {
			body: {
				fill: '#F39C12',
				stroke: '#000',
			},
			label: {
				text: 'End3',
				fill: '#333',
			},
		},
	});
	 const target4 = graph.addNode({
		shape: 'circle',
		x: 200,
		y: 300,
		width: 60,
		height: 60,
		attrs: {
			body: {
				fill: '#F39C12',
				stroke: '#000',
			},
			label: {
				text: 'End4',
				fill: '#333',
			},
			assetName:'23434',
			port: 123
		},
	});
    // 添加自定义边到图中
    const edge = graph.addEdge({
        shape: 'cometEdge',
        source: source,
        target:target,
		connector: { name: 'rounded' },
    });
	// 添加自定义边到图中
    const edge2 = graph.addEdge({
        shape: 'cometEdge',
        source: source,
        target:target2,
		connector: { name: 'smooth' },
    });
    // 添加自定义边到图中
    const edge3 = graph.addEdge({
        shape: 'cometEdge',
        source: target2,
        target:target3,
		//connector: { name: 'rounded' },
		router: {
			name: 'er',
			args: {
			  offset: 'center',
			},
		},
    });
	// 添加自定义边到图中
    const edge4 = graph.addEdge({
        shape: 'cometEdge',
        source: target,
        target:target4,
		connector: { name: 'rounded' },
    });

	const edge1 = graph.addEdge({
	  shape: 'edge', // 使用默认边形状,或者你自定义的边形状
	  source: target3,
	  target: target4,
	  attrs: {
		line: {
		  stroke: '#1890FF',
		  strokeWidth: 2,
		  strokeDasharray: '10,5', // 定义虚线模式
		  strokeDashoffset: 120, // 初始偏移量
		},
	  },
	});
	edge1.transition('attrs/line/strokeDashoffset', 0, {
	  delay: 0, // 延迟开始动画的时间,单位为毫秒
	  duration: 2000, // 动画持续时间,单位为毫秒
	  timing: 'linear', // 动画的时序函数
	  interp: (a, b) => (t) => a + (b - a) * t, // 插值函数
	});
	setTimeout(()=>{
		const edgeView3 = graph.findViewByCell(edge3);
		const connection3  = edgeView3.getConnection();
		const totalLength3 = edgeView3.getConnectionLength();
		const atLength = edgeView3.getPointAtLength(0);
		console.log(edgeView3,connection3,totalLength3,atLength,'||',target2.position());


		updateShortLine(edge3);
	},1000);


	let t = 1;
	const speed = 1;


	const update = (edgeParam,offset)=>{
		const edgeView = graph.findViewByCell(edgeParam);
		const connection  = edgeView.getConnection();
		const totalLength = edgeView.getConnectionLength();


		const shortLineLen = 5;//移动线段的长度
		let startPoint, endPoint;
		edgeParam.attr('shortLine/speed','5');
		//edgeParam.attr('shortLine/stroke','url(#redCometGradient)');

		startPoint= edgeView.getPointAtLength(offset);
		offset += speed;
		endPoint = edgeView.getPointAtLength(offset+shortLineLen);

		// 移动核心代码
		edgeParam.attr('shortLine', {
			d: `M ${startPoint.x} ${startPoint.y} L ${endPoint.x} ${endPoint.y} Z`,
		});


		if(totalLength<=offset){//复位
			offset = 0;
		}
		requestAnimationFrame(()=>{
			update(edgeParam,offset);
		})


	}
	setTimeout( () => {
		const edges = graph.getEdges();
		edges.forEach(edge => {
		  if('cometEdge' === edge.shape){
			update(edge,0);
		  }

		});

	},500);


});
</script>

</body>
</html>
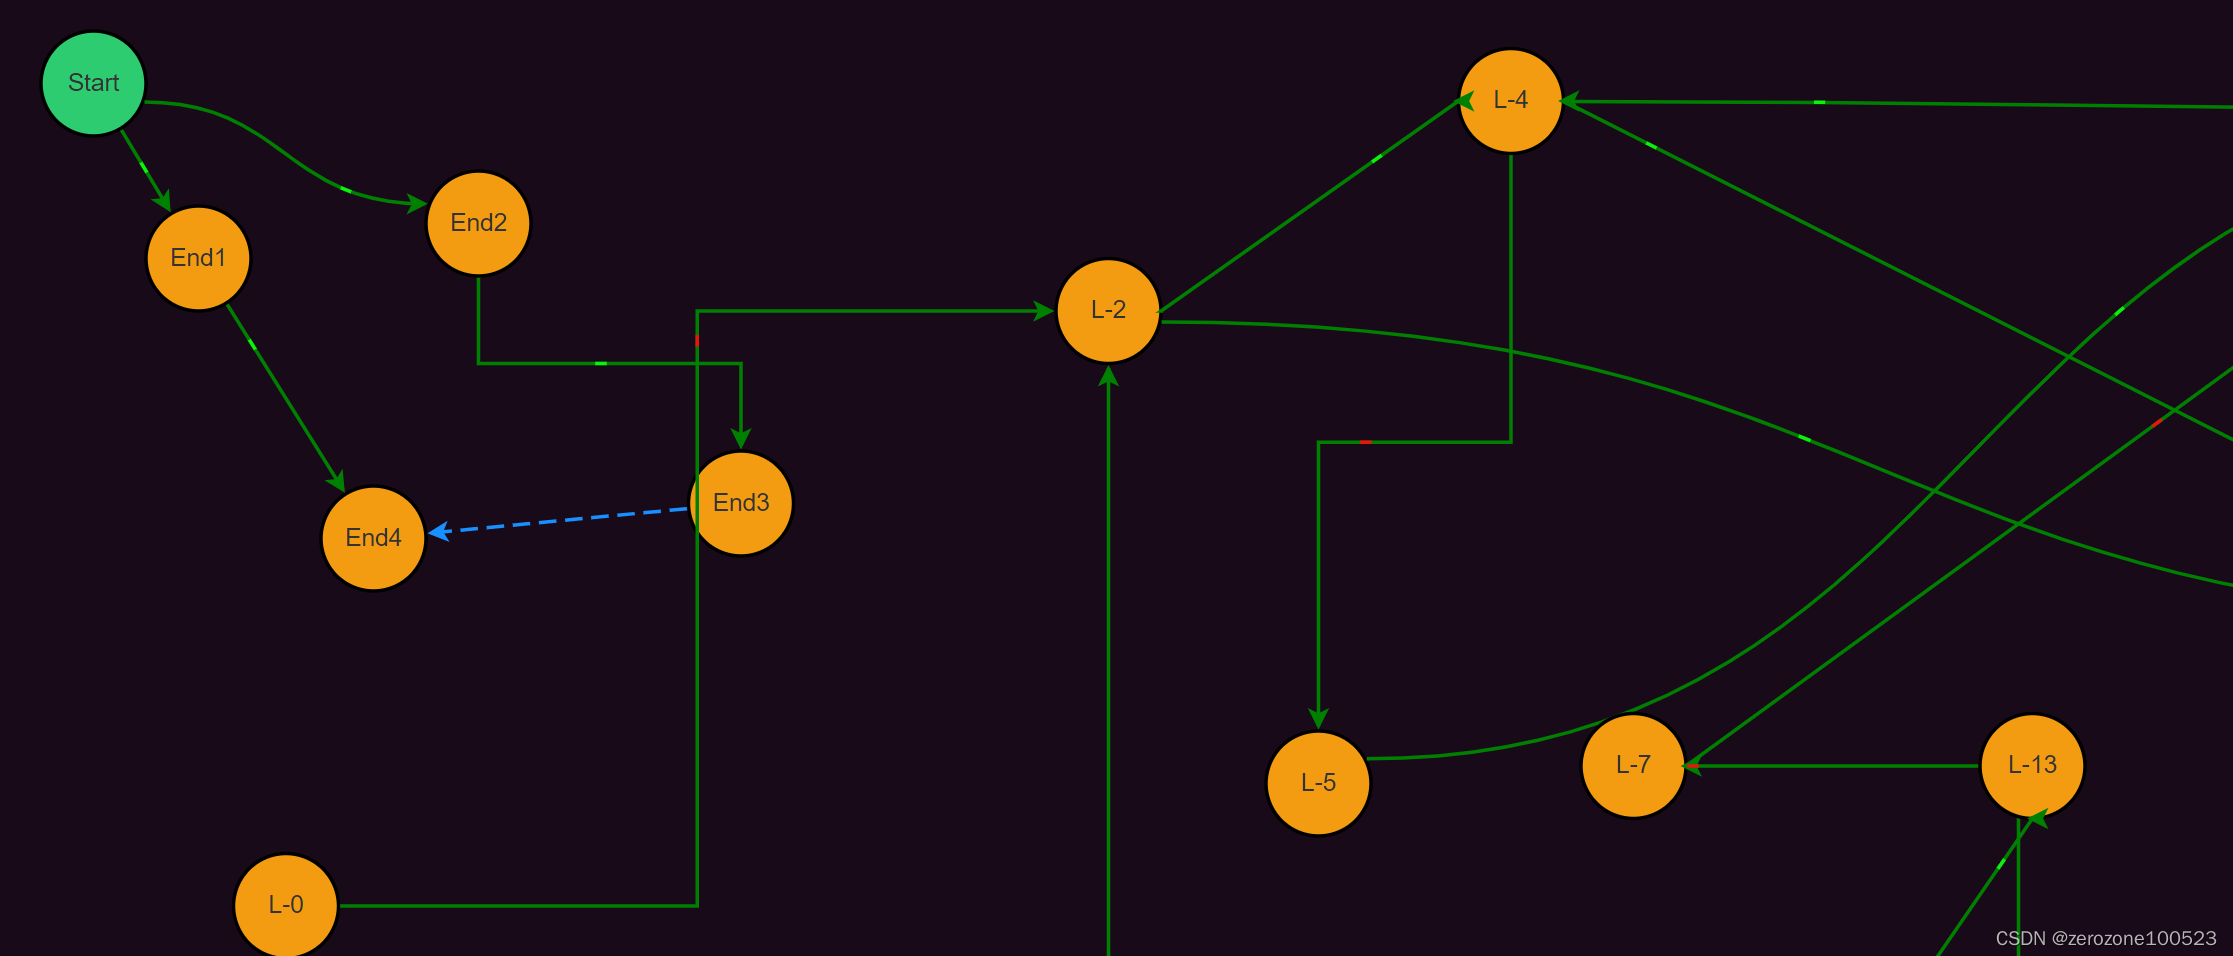
预览效果


 1479
1479


 被折叠的 条评论
为什么被折叠?
被折叠的 条评论
为什么被折叠?
 到【灌水乐园】发言


