int[] ProbeType = { 0, 0, 0, 0, 0, 0,};
float[] chartX = { 0, 0, 0, 0, 0, 0,};
GraphView graph,graph2;
    private LineGraphSeries<DataPoint> mSeries0 = new LineGraphSeries<DataPoint>();
    private LineGraphSeries<DataPoint> mSeries1 = new LineGraphSeries<DataPoint>();
    private LineGraphSeries<DataPoint> mSeries2 = new LineGraphSeries<DataPoint>();
    private LineGraphSeries<DataPoint> mSeries3 = new LineGraphSeries<DataPoint>();
    private LineGraphSeries<DataPoint> mSeries4 = new LineGraphSeries<DataPoint>();
    private LineGraphSeries<DataPoint> mSeries5 = new LineGraphSeries<DataPoint>();
DisplayMetrics dm = getResources().getDisplayMetrics()
graph = new GraphView(this)
graph.getViewport().setScalable(true)
graph.getViewport().setScrollable(true)
// set manual X bounds
graph.getViewport().setXAxisBoundsManual(true)
graph.getViewport().setMinX(0)
graph.getViewport().setMaxX(10)
// set manual Y bounds
graph.getViewport().setYAxisBoundsManual(true)
graph.getViewport().setMinY(0)
graph.getViewport().setMaxY(60)
graph.getViewport().setBackgroundColor(Color.LTGRAY)
//graph.getGridLabelRenderer().setHorizontalAxisTitle("时间")
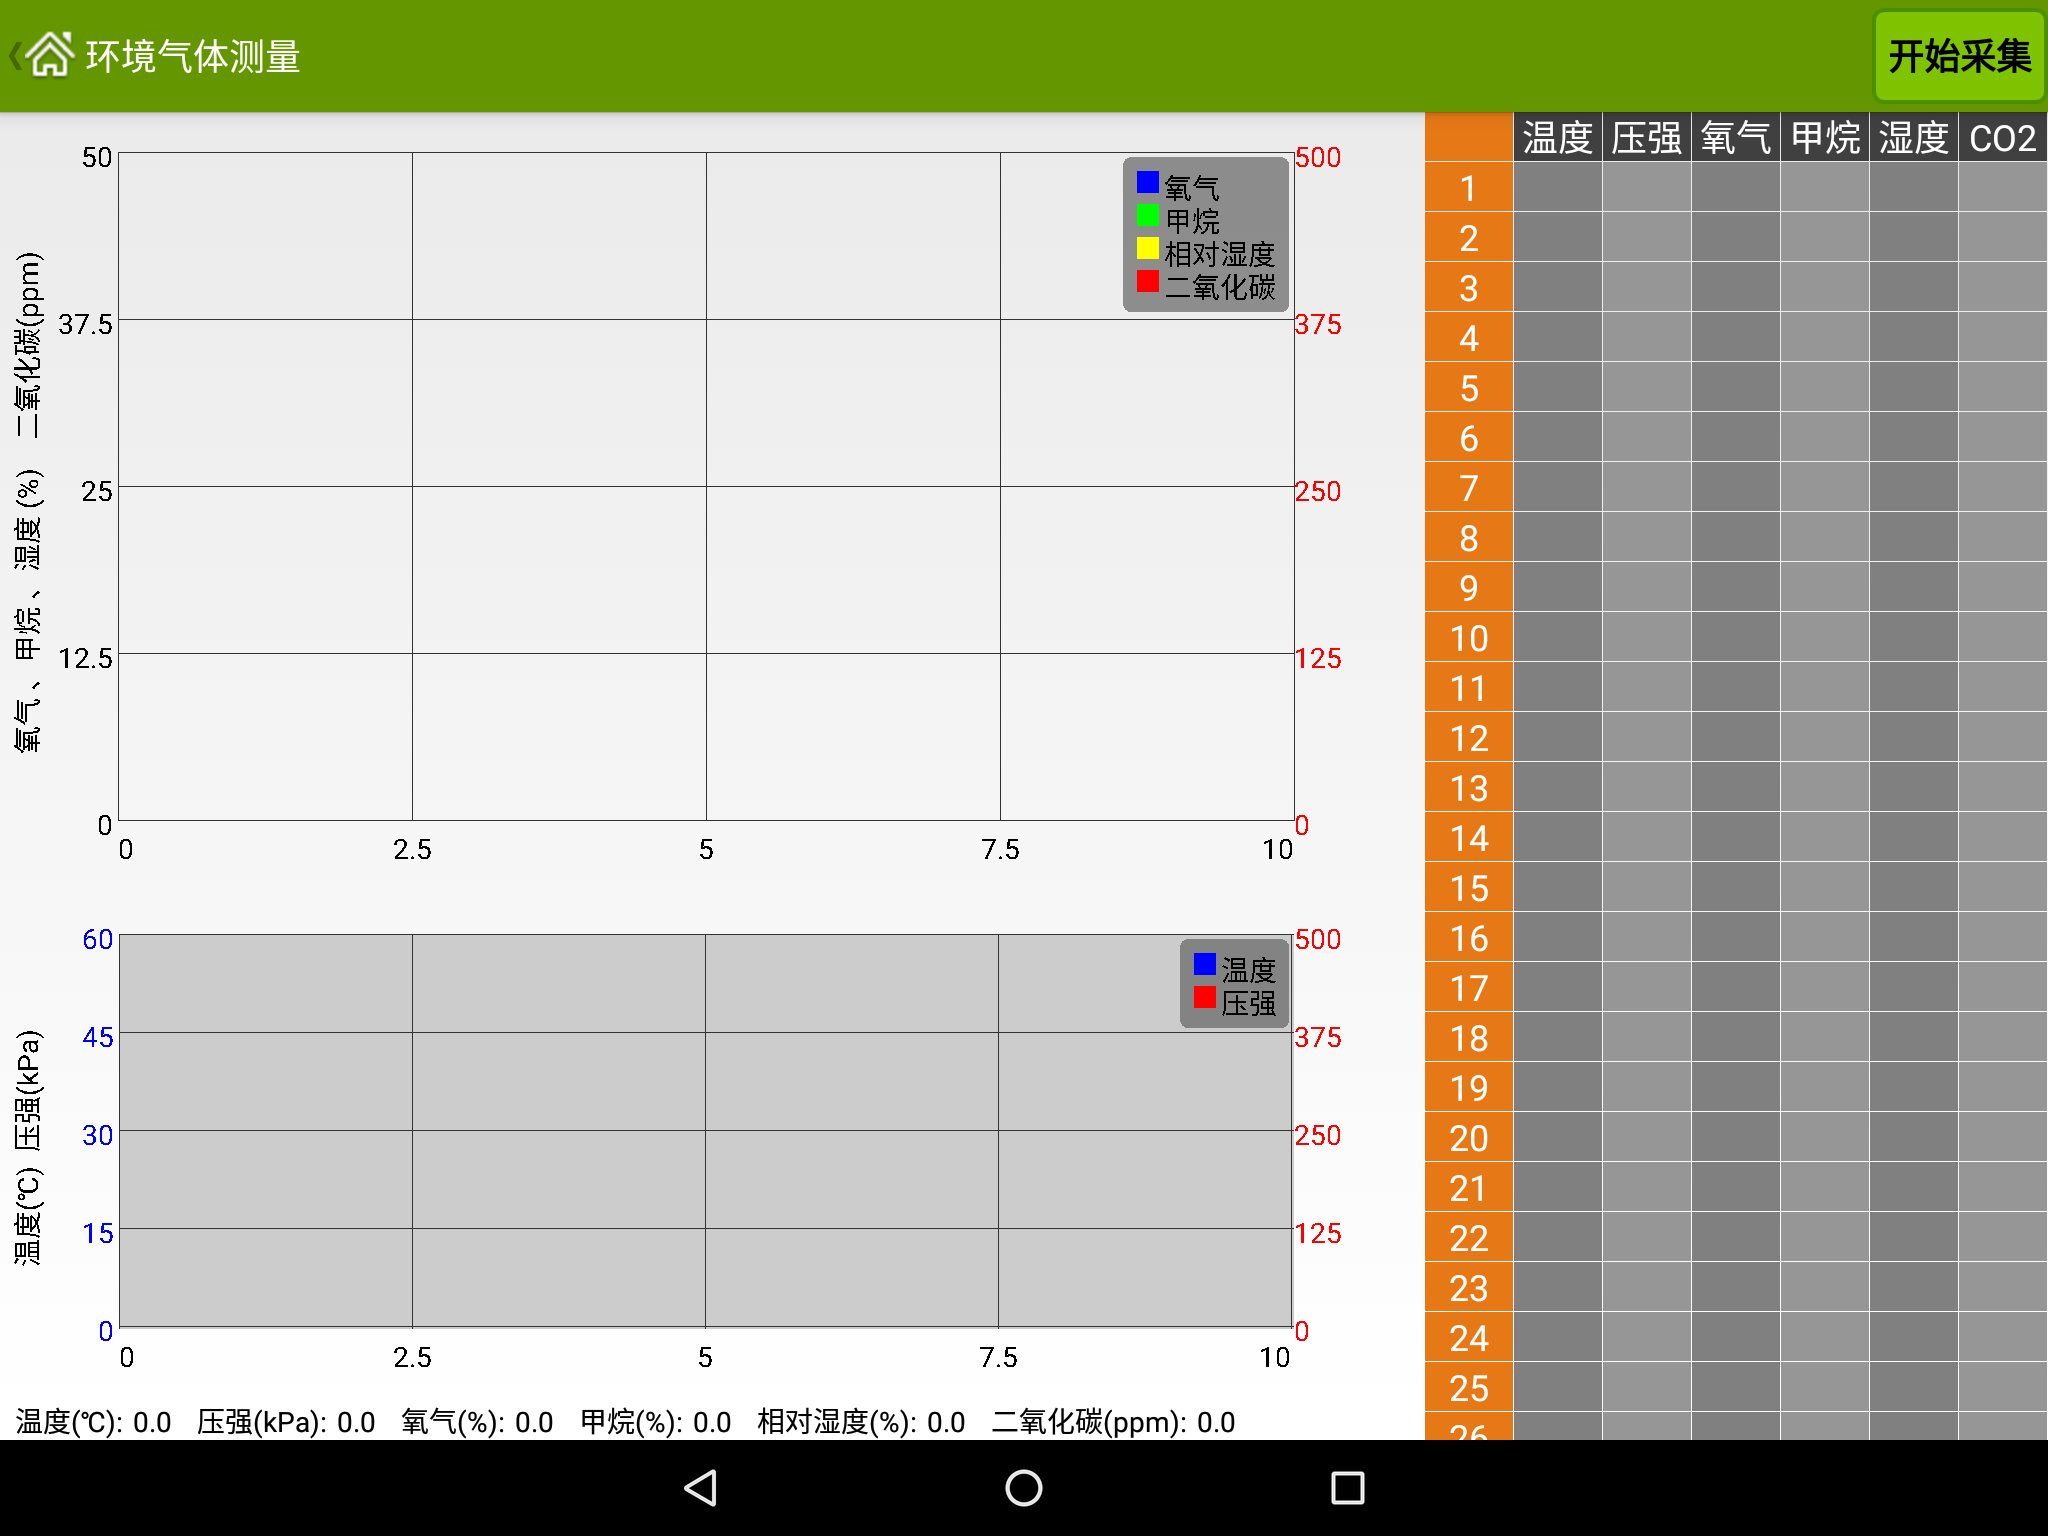
graph.getGridLabelRenderer().setVerticalAxisTitle("温度(℃) 压强(kPa)")
graph.getGridLabelRenderer().setPadding(40)
graph.getGridLabelRenderer().setVerticalLabelsColor(Color.BLUE)
graph.getGridLabelRenderer().setHighlightZeroLines(false)
//graph.getGridLabelRenderer().setGridStyle(GridStyle.NONE)
graph.getGridLabelRenderer().setGridColor(Color.CYAN)
//graph.setBackgroundResource(R.color.up_half_background_color)
LayoutParams lPgraph = new LayoutParams(dm.widthPixels*2/3,LayoutParams.WRAP_CONTENT)
lPgraph.setMargins(10, 0, 50, 0)
graph.setLayoutParams(lPgraph)
graph.setVisibility(View.VISIBLE)
// legend 设置图例
mSeries0.setTitle("温度")
mSeries0.setColor(Color.BLUE)
mSeries1.setTitle("压强")
mSeries1.setColor(Color.RED)
//把数据集放入画板
graph.addSeries(mSeries0)
graph.getLegendRenderer().setVisible(true)
graph.getLegendRenderer().setAlign(LegendAlign.TOP)
//graph.getGridLabelRenderer().setVerticalLabelsVisible(false)
//graph.getGridLabelRenderer().setHorizontalLabelsVisible(false)
// set second scale
graph.getSecondScale().addSeries(mSeries1)
// the y bounds are always manual for second scale
graph.getSecondScale().setMinY(0)
graph.getSecondScale().setMaxY(500)
graph.getGridLabelRenderer().setVerticalLabelsSecondScaleColor(Color.RED)
graph2 = new GraphView(this)
graph2.getViewport().setScalable(true)
graph2.getViewport().setScrollable(true)
// set manual X bounds
graph2.getViewport().setXAxisBoundsManual(true)
graph2.getViewport().setMinX(0)
graph2.getViewport().setMaxX(10)
// set manual Y bounds
graph2.getViewport().setYAxisBoundsManual(true)
graph2.getViewport().setMinY(0)
graph2.getViewport().setMaxY(50)
//graph2.getGridLabelRenderer().setHorizontalAxisTitle("时间")
graph2.getGridLabelRenderer().setVerticalAxisTitle("氧气 、甲烷 、湿度 (%) 二氧化碳(ppm)")
//graph2.getGridLabelRenderer().setLabelVerticalWidth(150)
//graph.getGridLabelRenderer().setVerticalLabelsAlign(Align.LEFT)
graph2.getGridLabelRenderer().setPadding(40)
graph2.getGridLabelRenderer().setHighlightZeroLines(false)
//graph.getGridLabelRenderer().setGridStyle(GridStyle.NONE)
graph2.getGridLabelRenderer().setGridColor(Color.CYAN)
//graph.setBackgroundResource(R.color.up_half_background_color)
graph2.setLayoutParams(lPgraph)
graph.setVisibility(View.VISIBLE)
// legend 设置图例
mSeries2.setTitle("氧气")
mSeries2.setColor(Color.BLUE)
mSeries3.setTitle("甲烷")
mSeries3.setColor(Color.GREEN)
mSeries4.setTitle("相对湿度")
mSeries4.setColor(Color.YELLOW)
mSeries5.setTitle("二氧化碳")
mSeries5.setColor(Color.RED)
//把数据集放入画板
graph2.addSeries(mSeries2)
graph2.addSeries(mSeries3)
graph2.addSeries(mSeries4)
graph2.getLegendRenderer().setVisible(true)
graph2.getLegendRenderer().setAlign(LegendAlign.TOP)
//graph.getGridLabelRenderer().setVerticalLabelsVisible(false)
//graph.getGridLabelRenderer().setHorizontalLabelsVisible(false)
// set second scale
graph2.getSecondScale().addSeries(mSeries5)
// the y bounds are always manual for second scale
graph2.getSecondScale().setMinY(0)
graph2.getSecondScale().setMaxY(500)
graph2.getGridLabelRenderer().setVerticalLabelsSecondScaleColor(Color.RED)
mSeries1.appendData(new DataPoint(chartX[index], fdat), true, 10);
chartX[index] += seq / 1000f;


 388
388


 被折叠的 条评论
为什么被折叠?
被折叠的 条评论
为什么被折叠?
 到【灌水乐园】发言


