


数据集
> toothpaste<-data.frame(
+ X1=c(-0.05, 0.25,0.60,0, 0.25,0.20, 0.15,0.05,-0.15, 0.15,+ 0.20, 0.10,0.40,0.45,0.35,0.30, 0.50,0.50, 0.40,-0.05,
+ -0.05,-0.10,0.20,0.10,0.50,0.60,-0.05,0, 0.05, 0.55),
+ X2=c( 5.50,6.75,7.25,5.50,7.00,6.50,6.75,5.25,5.25,6.00,
+ 6.50,6.25,7.00,6.90,6.80,6.80,7.10,7.00,6.80,6.50,
+ 6.25,6.00,6.50,7.00,6.80,6.80,6.50,5.75,5.80,6.80),
+ Y =c( 7.38,8.51,9.52,7.50,9.33,8.28,8.75,7.87,7.10,8.00,
+ 7.89,8.15,9.10,8.86,8.90,8.87,9.26,9.00,8.75,7.95,
+ 7.65,7.27,8.00,8.50,8.75,9.21,8.27,7.67,7.93,9.26)
+ )
> summary(lm.sol)
Call:
lm(formula = Y ~ X1 + X2, data = toothpaste)
Residuals:
Min 1Q Median 3Q Max
-0.49779 -0.12031 -0.00867 0.11084 0.58106
Coefficients:
Estimate Std. Error t value Pr(>|t|)
(Intercept) 4.4075 0.7223 6.102 1.62e-06 ***
X1 1.5883 0.2994 5.304 1.35e-05 ***
X2 0.5635 0.1191 4.733 6.25e-05 ***
---
Signif. codes: 0 ‘***’ 0.001 ‘**’ 0.01 ‘*’ 0.05 ‘.’ 0.1 ‘ ’ 1
Residual standard error: 0.2383 on 27 degrees of freedom
Multiple R-squared: 0.886, Adjusted R-squared: 0.8776
F-statistic: 105 on 2 and 27 DF, p-value: 1.845e-13
为了进一步分析
分别作出y与x1和x2的散点图
plot(Y~X1)
plot(Y~X2)
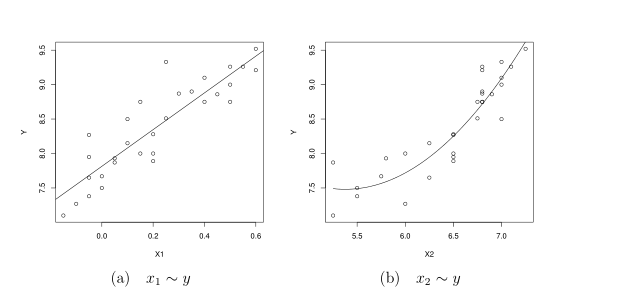
从图中可以看出y与X2可能是2次关系
所以对式子进行更新操作
lm.new <- update(lm.sol,.~.+I(X2^2))
> summary(lm.new)
Call:
lm(formula = Y ~ X1 + X2 + I(X2^2), data = toothpaste)
Residuals:
Min 1Q Median 3Q Max
-0.40330 -0.14509 -0.03035 0.15488 0.46602
Coefficients:
Estimate Std. Error t value Pr(>|t|)
(Intercept) 17.3244 5.6415 3.071 0.00495 **
X1 1.3070 0.3036 4.305 0.00021 ***
X2 -3.6956 1.8503 -1.997 0.05635 .
I(X2^2) 0.3486 0.1512 2.306 0.02934 *
---
Signif. codes: 0 ‘***’ 0.001 ‘**’ 0.01 ‘*’ 0.05 ‘.’ 0.1 ‘ ’ 1
Residual standard error: 0.2213 on 26 degrees of freedom
Multiple R-squared: 0.9054, Adjusted R-squared: 0.8945
F-statistic: 82.94 on 3 and 26 DF, p-value: 1.944e-13
可以看出x2的前面的系数为0的概率很大,尽管残差下降和r平方上升。
下面进行去掉x2项
> lm2.new <- update(lm.new,.~.-X2)
> summary(lm2.new)
Call:
lm(formula = Y ~ X1 + I(X2^2), data = toothpaste)
Residuals:
Min 1Q Median 3Q Max
-0.4859 -0.1141 -0.0046 0.1053 0.5592
Coefficients:
Estimate Std. Error t value Pr(>|t|)
(Intercept) 6.07667 0.35531 17.102 5.17e-16 ***
X1 1.52498 0.29859 5.107 2.28e-05 ***
I(X2^2) 0.04720 0.00952 4.958 3.41e-05 ***
---
Signif. codes: 0 ‘***’ 0.001 ‘**’ 0.01 ‘*’ 0.05 ‘.’ 0.1 ‘ ’ 1
Residual standard error: 0.2332 on 27 degrees of freedom
Multiple R-squared: 0.8909, Adjusted R-squared: 0.8828
F-statistic: 110.2 on 2 and 27 DF, p-value: 1.028e-13
此模型虽然过了T检验和F检验,但残差上升,r平方下降,所以可以尝试考虑,x1与x2的关系
更新式子
lm3.new<-update(lm.new, .~.+X1*X2)
> summary(lm3.new)
Call:
lm(formula = Y ~ X1 + X2 + I(X2^2) + X1:X2, data = toothpaste)
Residuals:
Min 1Q Median 3Q Max
-0.43725 -0.11754 0.00489 0.12263 0.38410
Coefficients:
Estimate Std. Error t value Pr(>|t|)
(Intercept) 29.1133 7.4832 3.890 0.000656 ***
X1 11.1342 4.4459 2.504 0.019153 *
X2 -7.6080 2.4691 -3.081 0.004963 **
I(X2^2) 0.6712 0.2027 3.312 0.002824 **
X1:X2 -1.4777 0.6672 -2.215 0.036105 *
---
Signif. codes: 0 ‘***’ 0.001 ‘**’ 0.01 ‘*’ 0.05 ‘.’ 0.1 ‘ ’ 1
Residual standard error: 0.2063 on 25 degrees of freedom
Multiple R-squared: 0.9209, Adjusted R-squared: 0.9083
F-statistic: 72.78 on 4 and 25 DF, p-value: 2.107e-13


 2600
2600


 被折叠的 条评论
为什么被折叠?
被折叠的 条评论
为什么被折叠?
 到【灌水乐园】发言


