


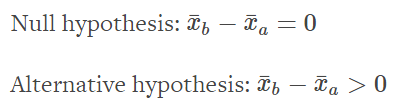
We first set up a null hypothesis that describes the status,then
state an alternative hypothesis. In the end, we either need to:
- reject the null hypothesis and accept the alternative hypothesis or
- accept the null hypothesis and reject the alternative hypothesis.
Task
- if a new weight loss pill helped people lose more weight:
- null hypothesis: patients who went on the weight loss pill lost no more weight than those who didn’t.
- alternative hypothesis: patients who went on the weight loss pill lost more weight than those who didn’t.
Research design
- Group A was given a placebo, or fake, pill and instrcuted to consumer
it on a daily basis. - Group B was given the actual weight loss pill and instructed to
consume it on a daily basis.
This type of study is called a blind experiment since the participants didn’t know which pill they were receiving. This helps us reduce the potential bias that is introduced when participants know which pill they were given.
Statistical significance
Statistics helps us determine if the difference in the weight lost between the 2 groups is because of random chance or because of an actual difference in the outcomes.
The lists weight_lost_a and weight_lost_b contain the amount of weight (in pounds) that the participants in each group lost.
import numpy as np
import matplotlib.pyplot as plt
mean_group_a = np.mean(weight_lost_a)
print(mean_group_a)
mean_group_b = np.mean(weight_lost_b)
print(mean_group_b)
plt.hist(weight_lost_a)
plt.show()
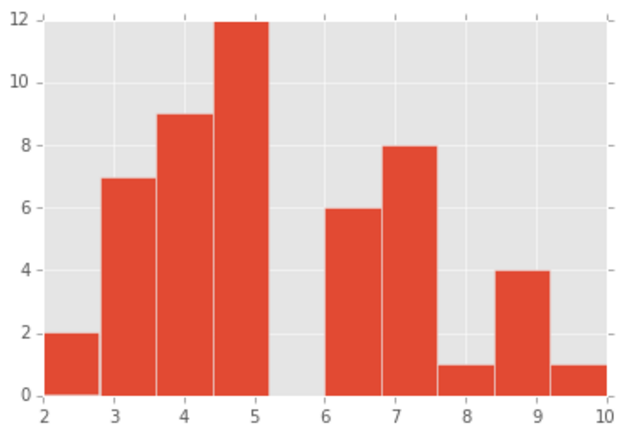
plt.hist(weight_lost_b)
plt.show()output:
2.82
5.34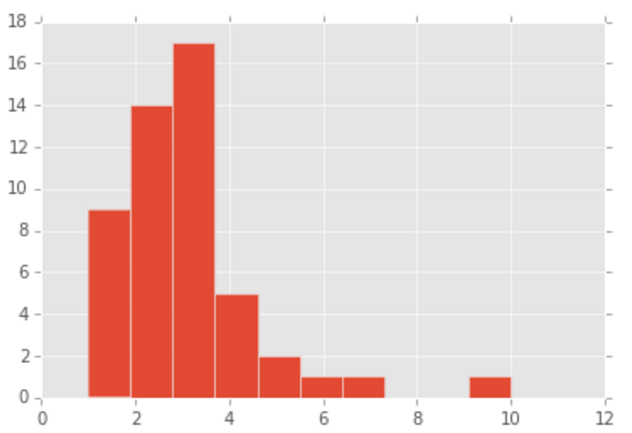
Test statistic
The first step is to decide on a test statistic, which is a numerical value that summarizes the data and we can use in statistical formulas.
Now that we have decided on a test statistic, we can rewrite our
hypotheses to be more precise:
mean_difference = mean_group_b - mean_group_a
print(mean_difference )
output:
2.52
Permutation test
The permutation test is a statistical test that involves simulating rerunning the study many times and recalculating the test statistic for each iteration. The goal is to calculate a distribution of the test statistics over these many iterations. This distribution is called the sampling distribution and it approximates the full range of possible test statistics under the null hypothesis.
If the observed mean difference of 2.52 should be quite common in the sampling distribution, the null hypothesis is true, and the weight loss pill doesn’t help people lose more weight . Otherwise, we accept the alternative hypothesis instead.
Ideally, the number of times we re-randomize the groups that each data point belongs to matches the total number of possible permutations.
mean_difference = 2.52
mean_differences = []
for i in range(1000):
    group_a = []
    group_b = []
    for value in all_values:
        assignment_chance = np.random.rand()
        if assignment_chance >= 0.5:
            group_a.append(value)
        else:
            group_b.append(value)
    iteration_mean_difference = np.mean(group_b) - np.mean(group_a)
    mean_differences.append(iteration_mean_difference)
plt.hist(mean_differences)
plt.show()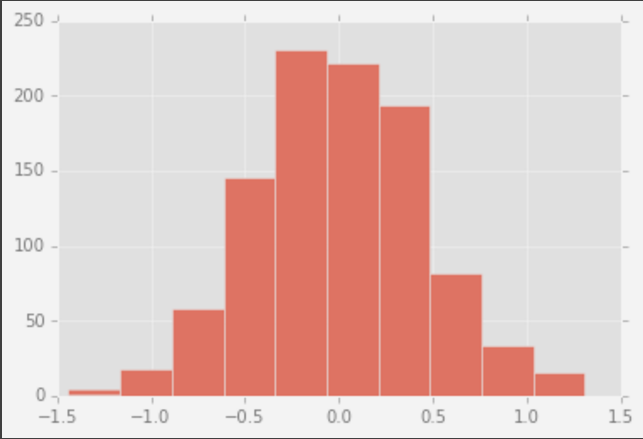
Sampling distribution
The keys in the dictionary should be the test statistic and the values should be their frequency:
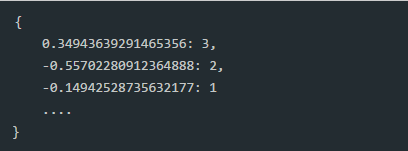
sampling_distribution = {}
for difference in mean_differences:
    if difference not in sampling_distribution:
        sampling_distribution[difference] = 1
    else:
        sampling_distribution[difference] += 1
P value
We can now use the sampling distribution to determine the number of times a value of 2.52 or higher appeared in our simulations.If we then divide that frequency by 1000, we’ll have the probability of observing a mean difference of 2.52 or higher purely due to random chance.This probability is called the p value.
In general, it’s good practice to set the p value threshold before conducting the study:
- if the p value is less than the threshold, we:
- reject the null hypothesis that there’s no difference in mean amount of weight lost by participants in both groups.
- accept the alternative hypothesis that the people who consumed the weight loss pill lost more weight.
- conclude that the weight loss pill does affect the amount of weight people lost.
- if the p value is greater than the threshold, we:
- accept the null hypothesis that there’s no difference in the mean amount of weight lost by participants in both groups,
- reject the alternative hypothesis that the people who consumed the weight loss pill lost more weight,
- conclude that the weight loss pill doesn’t seem to be effective in helping people lose more weight.
The most common p value threshold is 0.05 or 5%
Caveats
Since the p value of 0 is less than the threshold we set of 0.05, we conclude that the difference in weight lost can’t be attributed to random chance alone. We therefore reject the null hypothesis and accept the alternative hypothesis.
A few caveats:
- Research design is incredibly important and can bias your results.For example, if the participants in group A realized they were given placebo sugar pills, they may modify their behavior and affect the outcome.
- The p value threshold you set can also affect the conclusion you
reach.
- If you set too high of a p value threshold, you may accept the
alternative hypothesis incorrectly and fail to reject the null
hypothesis. This is known as a type I error. - If you set too low of a p value threshold, you may reject the
alternative hypothesis incorrectly in favor of accepting the null
hypothesis. This is known as a type II error.
- If you set too high of a p value threshold, you may accept the


 1575
1575

 被折叠的 条评论
为什么被折叠?
被折叠的 条评论
为什么被折叠?
 到【灌水乐园】发言


