for i =[500,1000,2000,5000,10000];
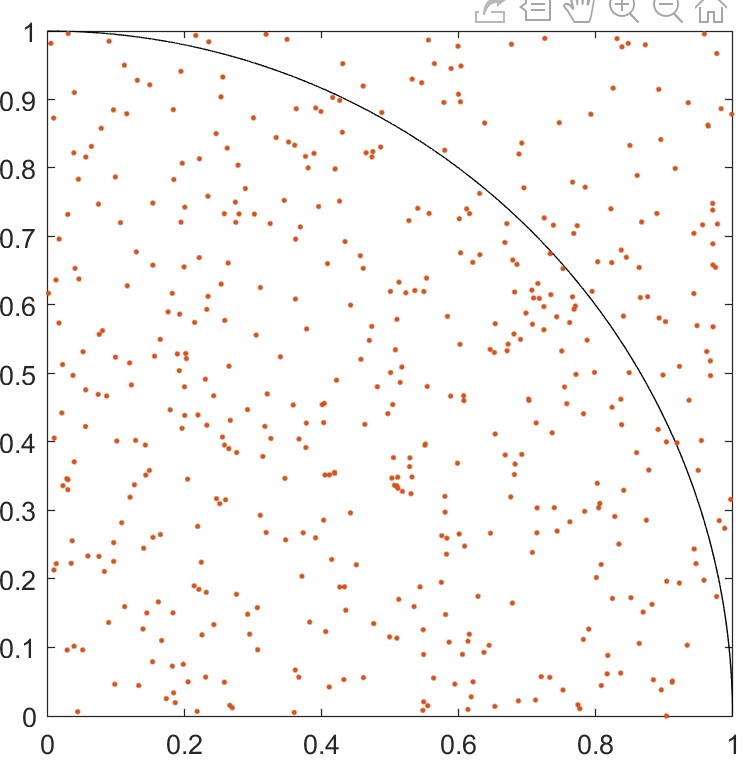
%画出1/4圆
x1=linspace(0,1,10000);
y1=(1-x1.^2).^0.5;
x2=rand([1,i]);%1行500列
y2=rand([1,i]);
count=0;
for j=1:i
if x2(j)^2+y2(j)^2<=1
count=count+1;
end
end
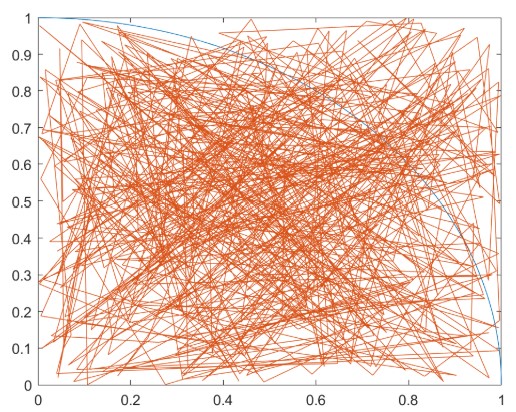
plot(x1,y1,'k',x2,y2,'.')%第一个'k'是调整线条颜色,第二个'.'是使得随机的点分开。
title([num2str(count)+" / "+num2str(i)+" * 4 = "+num2str(count/i*4)]);
axis square;
frame=getframe(gcf);%捕获坐标区或图窗作为影片帧
I=frame2im(frame); %返回与影片帧关联的图像数据
[I,map]=rgb2ind(I,256);%将RGB
if i==500
imwrite(I,map,'test.gif','gif','LoopCount',inf,"DelayTime",0.2);
else
imwrite(I,map,'test.gif','gif','WriteMode','append','DelayTime',0.2);%此处时间间隙为0.2s
end
end


 331
331


 被折叠的 条评论
为什么被折叠?
被折叠的 条评论
为什么被折叠?
 到【灌水乐园】发言


