


G2Plot 的功能是可以的,但是文档是稀烂,压根就没写清楚什么属性支持什么地方,对应的属性也不写清楚可使用什么子属性,稀烂!
-
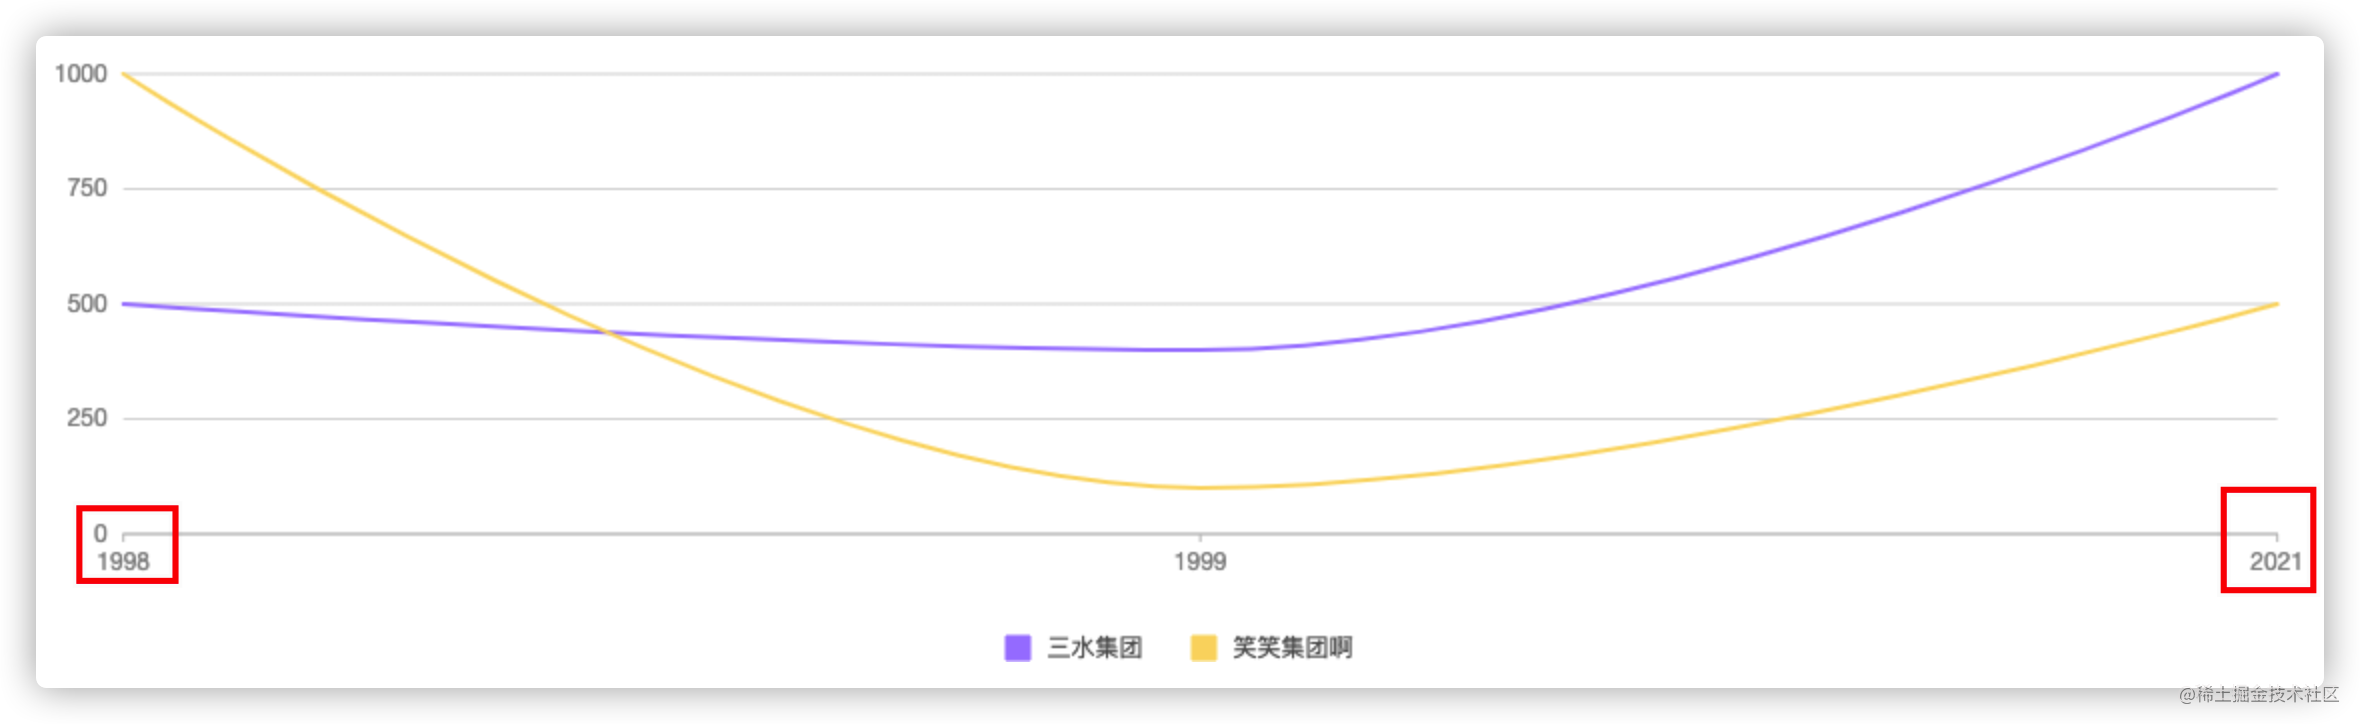
留白配置主要是
range属性,这个属性支持很多地方,但是没写清楚哪些地方可以用// x轴配置 xAxis: { // 轴头尾留空白,0 - 1 取值,0 是最左边,1 是最右边 range: [0, 1] } -
下面是案例代码
<template>
  <!-- 图表 -->
  <div id="Line1"></div>
</template>

<script>
// 导入
import { Line } from '@antv/g2plot'
export default {
  mounted () {
    // 数据源
    const dataSource = [
      {
        title: '1998年5月',
        team: '三水集团',
        time: '1998',
        num: 500
      },
      {
        title: '1999年5月',
        team: '三水集团',
        time: '1999',
        num: 400
      },
      {
        title: '2021年5月',
        team: '三水集团',
        time: '2021',
        num: 1000
      },
      {
        title: '1998年6月',
        team: '笑笑集团啊',
        time: '1998',
        num: 1000
      },
      {
        title: '1999年6月',
        team: '笑笑集团啊',
        time: '1999',
        num: 100
      },
      {
        title: '2021年6月',
        team: '笑笑集团啊',
        time: '2021',
        num: 500
      }
    ]
    // 创建
    const chart = new Line('Line1', {
      // 数据源
      data: dataSource,
      // x轴对应key,横向线
      xField: 'time',
      // y轴对应key,竖向线
      yField: 'num',
      // 分组对应 key,多组数据
      seriesField: 'team',
      // 线条是否为弧度
      smooth: true,
      // x轴配置
      xAxis: {
        // 轴头尾留空白
        range: [0, 1]
      },
      // 提示
      tooltip: {
        // 标题,设置的值,如果为字段key,则会从数据源中取值显示,如果数据源没有该key,则直接显示
        title: 'title',
        // 允许鼠标滑入提示框
        // enterable: true,
        // 自定义
        containerTpl: `
          <div class="g2-tooltip">
            <div class="g2-tooltip-title"></div>
            <ul class="g2-tooltip-list"></ul>
            <li class="g2-tooltip-list-item">
              <span class="g2-tooltip-marker"></span>
              <span class="g2-tooltip-name">总计</span>:
              <span class="g2-tooltip-value">100000</span>
            </li>
          </div>
        `,
        // 自定义 item 模板
        itemTpl: `
          <li class="g2-tooltip-list-item">
            <span class="g2-tooltip-marker" style="background-color: {color};"></span>
            <span class="g2-tooltip-name">{name}</span>:
            <span class="g2-tooltip-value">{value}</span>
          </li>
        `,
        // 是否显示 hover 辅助线
        showCrosshairs: true,
        // 辅助线配置
        crosshairs: {
          // x 表示 x 轴上的辅助线,y 表示 y 轴上的辅助线,xy 表示两条辅助线
          type: 'x',
          // 辅助线是否跟随鼠标移动
          follow: false,
          // 辅助线配置
          line: {
            // 样式配置
            style: {
              // 线宽
              lineWidth: 0.5
            }
          }
        }
      },
      // 图例列表
      legend: {
        // y轴偏移
        offsetY: 15,
        // 摆放位置
        position: 'bottom',
        // 图例高度
        itemHeight: 28,
        // 配置图例
        marker: {
          // 图例样式
          style: (style) => {
            // 重组样式
            return {
              // 半径
              r: 6,
              // 样式类型
              symbol: 'square',
              // 填充
              fill: style.fill || style.stroke,
              // 边框线宽
              lineWidth: 1,
              // 边框填充颜色
              stroke: style.fill || style.stroke,
              // 边框透明度
              strokeOpacity: 1,
              // 线圆角
              lineCap: 'round',
              lineJoin: 'round'
            }
          }
        }
      },
      // 主题配置
      theme: {
        // 分类个数小于 10 时使用
        colors10: ['#A685FF', '#FBD86D']
        // 分类个数大于 10 时使用
        // colors20: ['#A685FF', '#FBD86D']
      },
      // 动画配置
      // https://g2plot.antv.vision/zh/docs/api/options/animation
      animation: {
        // 配置图表第一次加载时的入场动画
        appear: {
          // 动画效果
          animation: 'wave-in',
          // 动画执行时间
          duration: 2000
        }
      }
    })
    // 绘制
    chart.render()
    // 更新配置
    // chart.update({ xField: 'num' })
    // 更新数据
    // chart.changeData(dataSource)
    // 销毁
    // chart.destroy()
  }
}
</script>

<style>

</style>


 1万+
1万+


 被折叠的 条评论
为什么被折叠?
被折叠的 条评论
为什么被折叠?
 到【灌水乐园】发言


