


开发时遇到的问题如标题所说
先说解决方案:
1.如果x轴 是数字 第一个必须是0,否则y轴将会少一块
2.尽量将x轴 设为 string类型,也就是字符串
例如:
let inidD = [
    { month: 1, revenue: 1322, name: "2022每月产出" },
    { month: 2, revenue: 1333, name: "2022每月产出" },
    { month: 3, revenue: 22, name: "2022每月产出" },
    { month: 4, revenue: 512, name: "2022每月产出" },
    { month: 5, revenue: 543, name: "2022每月产出" },
    { month: 6, revenue: 132, name: "2022每月产出" },
    { month: 7, revenue: 3437, name: "2022每月产出" },
    { month: 8, revenue: 2111, name: "2022每月产出" },
    { month: 9, revenue: 335, name: "2022每月产出" },
    { month: 10, revenue: 37, name: "2022每月产出" },
    { month: 11, revenue: 3464, name: "2022每月产出" },
    { month: 12, revenue: 600, name: "2022每月产出" },

  ];

 const linePlot = new Line('container', {
            data: inidD,
            xField: 'month',
            yField: 'revenue',
            seriesField: 'name',
            legend: {
              position: 'top-right',
            },
            animation: {
              appear: {
                animation: 'wave-in',
                duration: 3000,
              },
            },
          });

 linePlot.render();
x轴是 month 字段. y轴是 revenue 字段,执行渲染后就会少一条y轴数据
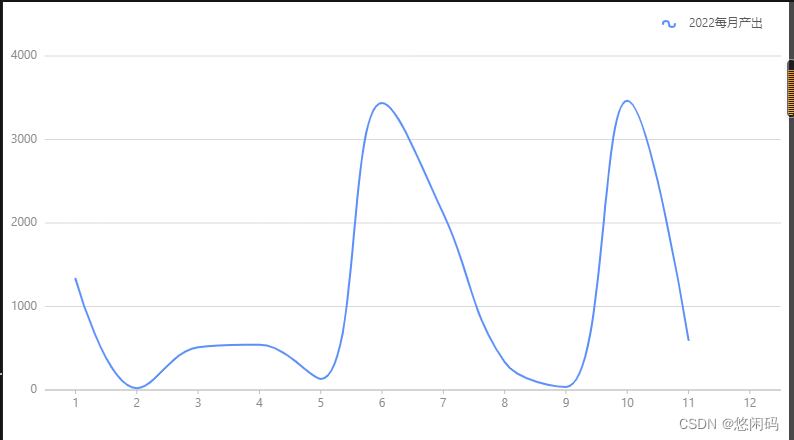
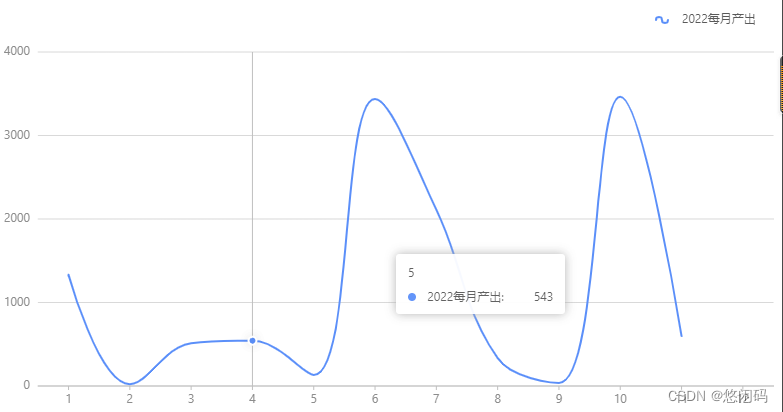
并且鼠标悬浮图表会出现错位
可以采用方案1 不转换字符串,改成第一条数据x轴为0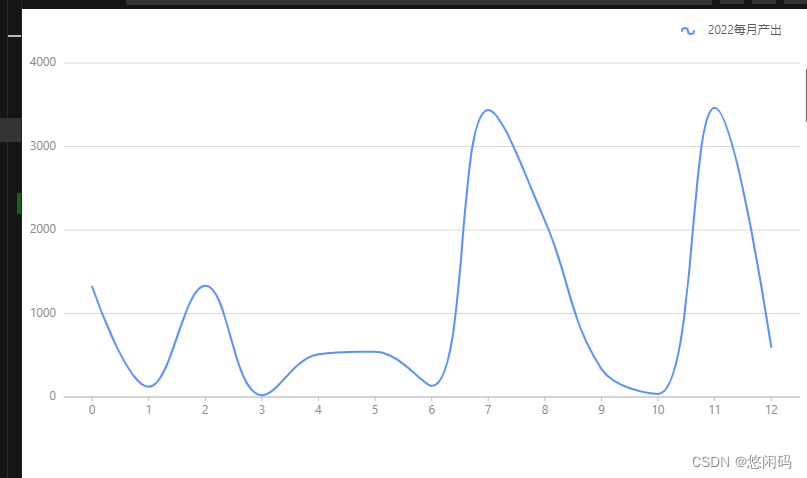
推荐直接采取方案2 将x轴转换成字符串即可恢复正常
inidD.map(item => {
    item.month = item.month.toString()
})
总结:应该是个bug,希望官方能尽快修复


 688
688


 被折叠的 条评论
为什么被折叠?
被折叠的 条评论
为什么被折叠?
 到【灌水乐园】发言


