


A=imread("C:\Users\HP\Desktop\kodim22.png");
% get the histogram
[Y,X]=size(A); % Y Row , X column
grayvalue=unique(A);
imginfo=[];
for i=1:length(grayvalue)
[ANSy,ANSx]=find(A==grayvalue(i));
imginfo.gray(i)=grayvalue(i);
imginfo.position{i}=[ANSy,ANSx];
imginfo.count(i)=length(ANSy)/(Y*X);
end
subplot(1,2,1);
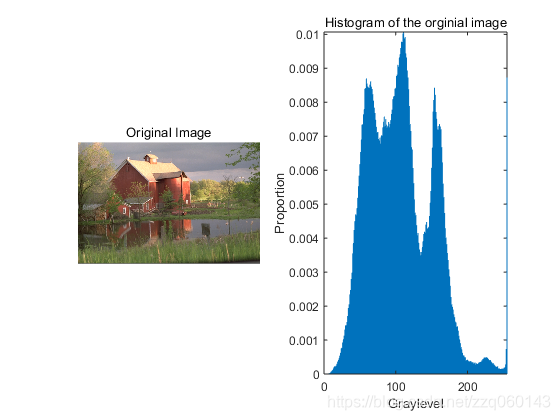
imshow(A);
title('Original Image');
subplot(1,2,2);
stem(imginfo.gray,imginfo.count,'Marker','none');
xlabel('Graylevel');
ylabel('Proportion');
axis([0 255 0 max(imginfo.count)]);
title('Histogram of the orginial image')
实现的最终效果图:


 516
516


 被折叠的 条评论
为什么被折叠?
被折叠的 条评论
为什么被折叠?
 到【灌水乐园】发言


