本文出自:http://blog.csdn.net/dt235201314/article/details/52222088
MPAndroidChart常见设置属性(一)——应用层
MPAndroidChart项目实战(一)——实现对比性柱状图
MPAndroidChart项目实战(二)——双平滑曲线(双折线图)和MarkView实现
MPAndroidChart项目实战(三)——饼状图实现和文字重合问题解决
MPAndroidChart项目实战(四)——柱状图实现及X轴文字不显示问题和柱状图上显示文字
MPAndroidChart X轴文字斜着显示
MPAndroidChart项目实战(五)——组合图实现趋势图
MPAndroidChart项目实战(六)——自定义1MPAndroidChart滑动冲突解决(搞不定产品设计师就只能搞自己)
MPAndroidChart项目实战(七)——自定义横向柱状图
MPAndroidChart项目实战(八)——自定义分段堆积柱状图
MPAndroidChart项目实战(九)——自定义带文字分段堆积柱状图
一丶简述
上一篇简单介绍了有关MPAndroidChart,及一些相关得博文链接,并说到了工作上的问题。这一篇就总结一下应用层,如何运用MPAndroidChart
每一篇博文都有自己特点和不足,不可能满足有所读者的需求,相同的需求都会不同的UI
二丶MPAndroidChart常见设置属性(又是选择性copy)
代码居然被压缩了,主要看属性和效果图
一、使用
为了使用 LineChart, BarChart, ScatterChart, CandleStickChart, PieChart, BubbleChart or RadarChart ,要在 .xml 文件定义:
<com.github.mikephil.charting.charts.LineChart
        android:id="@+id/chart"
        android:layout_width="match_parent"
        android:layout_height="match_parent" />
然后在 Activity 或 Fragment 中拿到你定义的 chart:
LineChart chart = (LineChart) findViewById(R.id.chart);
使用 java 代码创建它(如果不是在布局文件中定义,需要将其加入你的布局):
// programmatically create a LineChart
    LineChart chart = new LineChart(Context);

    // get a layout defined in xml
    RelativeLayout rl = (RelativeLayout) findViewById(R.id.relativeLayout);
    rl.add(chart); // add the programmatically created chart
二、刷新
- invalidate() : 在chart中调用会使其刷新重绘
- notifyDataSetChanged() : 让chart知道它依赖的基础数据已经改变,并执行所有必要的重新计算(比如偏移量,legend,最大值,最小值 …)。在动态添加数据时需要用到。
三、打印日志
- setLogEnabled(boolean enabled) : 设置为true将激活chart的logcat输出。但这不利于性能,如果不是必要的,应保持禁用。
四、基本chart风格
这里我们先定义一个LineChart范例:
<!--折线图,layout的背景色为 #bdbdbd 灰-->
        <com.github.mikephil.charting.charts.LineChart
            android:id="@+id/line_chart"
            android:layout_width="match_parent"
            android:layout_height="300dp"
            android:background="#ffffff"
            android:layout_margin="16dp"/>
下面是一些可以直接在 chart 上使用的设置 style 的方法:
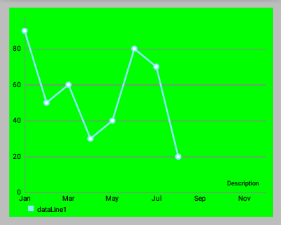
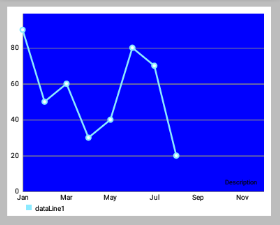
setBackgroundColor(int color): 设置背景颜色,将覆盖整个图表视图。 此外,背景颜色可以在布局文件.xml中进行设置。
注意:设置颜色时要ARGB完整的八位(如 0xff00ff00),否则可能会被视为“设置透明颜色”(如 0xff0000)
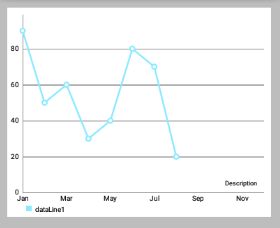
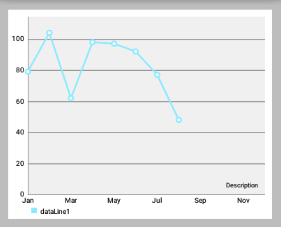
setDescription(String desc): 设置图表的描述文字,会显示在图表的右下角。-
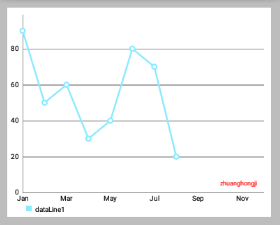
setDescriptionColor(int color): 设置描述文字的颜色。 -
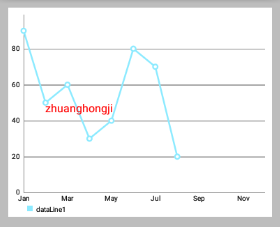
setDescriptionPosition(float x, float y): 自定义描述文字在屏幕上的位置(单位是像素)。 setDescriptionTypeface(Typeface t): 设置描述文字的 Typeface。-
setDescriptionTextSize(float size): 设置以像素为单位的描述文字,最小6f,最大16f。 -
setNoDataTextDescription(String desc): 设置当 chart 为空时显示的描述文字。 -
setDrawGridBackground(boolean enabled): 如果启用,chart 绘图区后面的背景矩形将绘制。 -
setGridBackgroundColor(int color): 设置网格背景应与绘制的颜色。 -
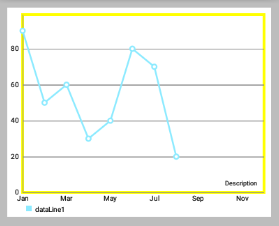
setDrawBorders(boolean enabled): 启用/禁用绘制图表边框(chart周围的线)。 setBorderColor(int color): 设置 chart 边框线的颜色。setBorderWidth(float width): 设置 chart 边界线的宽度,单位 dp。-
-
setMaxVisibleValueCount(int count): 设置最大可见绘制的 chart count 的数量。 只在setDrawValues()设置为true时有效。
启用/ 禁止 手势交互
setTouchEnabled(boolean enabled): 启用/禁用与图表的所有可能的触摸交互。setDragEnabled(boolean enabled): 启用/禁用拖动(平移)图表。setScaleEnabled(boolean enabled): 启用/禁用缩放图表上的两个轴。setScaleXEnabled(boolean enabled): 启用/禁用缩放在x轴上。setScaleYEnabled(boolean enabled): 启用/禁用缩放在y轴。setPinchZoom(boolean enabled): 如果设置为true,捏缩放功能。 如果false,x轴和y轴可分别放大。setDoubleTapToZoomEnabled(boolean enabled): 设置为false以禁止通过在其上双击缩放图表。setHighlightPerDragEnabled(boolean enabled): 设置为true,允许每个图表表面拖过,当它完全缩小突出。 默认值:truesetHighlightPerTapEnabled(boolean enabled): 设置为false,以防止值由敲击姿态被突出显示。 值仍然可以通过拖动或编程方式突出显示。 默认值:true
图表的 抛掷/减速
setDragDecelerationEnabled(boolean enabled): 如果设置为true,手指滑动抛掷图表后继续减速滚动。 默认值:true。setDragDecelerationFrictionCoef(float coef): 减速的摩擦系数在[0; 1]区间,数值越高表示速度会缓慢下降,例如,如果将其设置为0,将立即停止。 1是一个无效的值,会自动转换至0.9999。
高亮
highlightValues(Highlight[] highs): 高亮显示值,高亮显示的点击的位置在数据集中的值。 设置null或空数组则撤消所有高亮。highlightValue(int xIndex, int dataSetIndex): 高亮给定xIndex在数据集的值。 设置xIndex或dataSetIndex为-1撤消所有高亮。getHighlighted(): 返回一个Highlight[]其中包含所有高亮对象的信息,xIndex和dataSetIndex。
以java编程方式使得值高亮不会回调 OnChartValueSelectedListener .
选择回调
MPAndroidChart 提供了许多用于交互回调的方法,其中 OnChartValueSelectedListener 在点击高亮值时回调。
public interface OnChartValueSelectedListener {
    /**
    * Called when a value has been selected inside the chart.
    *
    * @param e The selected Entry.
    * @param dataSetIndex The index in the datasets array of the data object
    * the Entrys DataSet is in.
    * @param h the corresponding highlight object that contains information
    * about the highlighted position
    */
    public void onValueSelected(Entry e, int dataSetIndex, Highlight h);
    /**
    * Called when nothing has been selected or an "un-select" has been made.
    */
    public void onNothingSelected();
}
让你的类实现该接口并设置对 chart 进行监听,即可接受回调。
Simply let your class that should receive the callbacks implement this interface and set it as a listener to the chart:
chart.setOnChartValueSelectedListener(this);
手势回调
监听器 OnChartGestureListener 可以使得 chart 与手势操作进行交互。
public interface OnChartGestureListener {

    /**
     * Callbacks when a touch-gesture has started on the chart (ACTION_DOWN)
     *
     * @param me
     * @param lastPerformedGesture
     */
    void onChartGestureStart(MotionEvent me, ChartTouchListener.ChartGesture lastPerformedGesture);

    /**
     * Callbacks when a touch-gesture has ended on the chart (ACTION_UP, ACTION_CANCEL)
     *
     * @param me
     * @param lastPerformedGesture
     */
    void onChartGestureEnd(MotionEvent me, ChartTouchListener.ChartGesture lastPerformedGesture);

    /**
     * Callbacks when the chart is longpressed.
     *
     * @param me
     */
    public void onChartLongPressed(MotionEvent me);

    /**
     * Callbacks when the chart is double-tapped.
     *
     * @param me


 本文详细介绍了MPAndroidChart在应用层的常见设置,包括使用、刷新、日志、基本样式、手势交互、图表风格、坐标轴、ChartData、数据设置和颜色管理等方面,提供了丰富的代码示例和配置选项,旨在帮助开发者更好地理解和定制图表。
 最低0.47元/天 解锁文章


 9577
9577


