


 本文详细介绍了如何使用Matplotlib进行图形美化,包括调整坐标轴和刻度、添加标题和注释文本、设置线条和文本字体、运用颜色以及划分画布。通过实例展示了如何设置坐标轴范围、刻度样式、添加网格线和移动坐标轴,以及设置图形标题、注释和图例。此外,还讲解了线型样式、颜色参数、色彩映射和颜色标尺的使用,以及如何通过subplots()和subplot()函数进行画布布局。
1. 调整坐标轴和刻度
作为函数图像那个的必要组成部分,坐标轴和刻度直接反映了图形中变量的数值规模的范围
适当的调整和美化坐标轴及刻度能够让图形一目了然。
1.1 设置坐标轴刻度
刻度是图形的一部分,由刻度定位器(Tick Locator)和刻度格式器(Tick Formatter)两部分组成,其中刻度定位器用于制定刻度所在的位置,刻度格式器用于制定刻度显示。
刻度分为主刻度(Major Ticks)和次刻度(Minor Ticks),可以分别制定二者的位置和格式,次刻度默认为不显示。
为了展示设置刻度参数的效果,可以先使用plot()函数生成一条余弦曲线,代码如下:
import matplotlib.pyplot as plt
import numpy as np
from matplotlib.ticker import AutoLocator,MultipleLocator,FormatStrFormatter
x=np.linspace(0,5,100)
y=np.cos(x)
fig=plt.figure(figsize=(4,4))
ax=fig.add_subplot(111)
ax.plot(x,y,lw=2)
plt.show()
接着设置坐标轴范围和主,次坐标轴
import matplotlib.pyplot as plt
import numpy as np
from matplotlib.ticker import AutoMinorLocator,MultipleLocator,FormatStrFormatter
x=np.linspace(0,5,100)
y=np.cos(x)
fig=plt.figure(figsize=(4,4))
ax=fig.add_subplot(111)

ax.set_xlim(0,5)
ax.set_ylim(-1.5,1.5)
ax.xaxis.set_major_locator(MultipleLocator(1)) #将主刻度设为1的倍数
ax.yaxis.set_major_locator(MultipleLocator(1))
ax.xaxis.set_minor_locator(AutoMinorLocator(2))
ax.yaxis.set_minor_locator(AutoMinorLocator(5))


ax.plot(x,y,lw=2)
plt.show()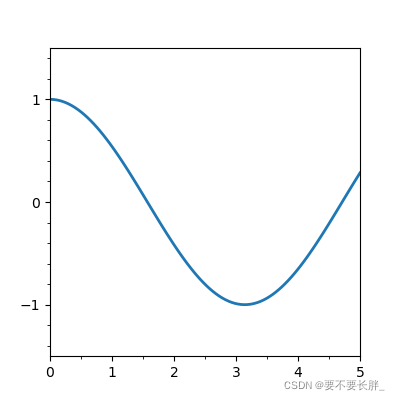
可见,手工设置坐标轴范围和加入次坐标轴后,横轴的两个主刻度之间被平分成了两等分
纵轴的两个刻度之间被平均分成了5等分,而且曲线的弯曲程度也随之发生了一些变化。
1.2 设置坐标轴的标签文本
为了将次刻度对应的数值显示出来,可以使用以下代码调整坐标轴刻度的显示样式
import matplotlib.pyplot as plt
import numpy as np
from matplotlib.ticker import AutoMinorLocator,MultipleLocator,FormatStrFormatter
x=np.linspace(0,5,100)
y=np.cos(x)
fig=plt.figure(figsize=(4,4))
ax=fig.add_subplot(111)

ax.set_xlim(0,5)
ax.set_ylim(-1.5,1.5)
ax.xaxis.set_major_locator(MultipleLocator(1)) #将主刻度设为1的倍数
ax.yaxis.set_major_locator(MultipleLocator(1))
ax.xaxis.set_minor_locator(AutoMinorLocator(2))
ax.yaxis.set_minor_locator(AutoMinorLocator(5))

ax.xaxis.set_minor_formatter(FormatStrFormatter('%5.1f')) #设置x轴标签文本格式
ax.yaxis.set_minor_formatter(FormatStrFormatter('%5.1f'))
ax.tick_params(which='minor',length=5,width=1,labelsize=8,labelcolor='r')
ax.tick_params('y',which='major',length=8,width=1,labelsize=10,labelcolor='b')
ax.plot(x,y,lw=2)
plt.show()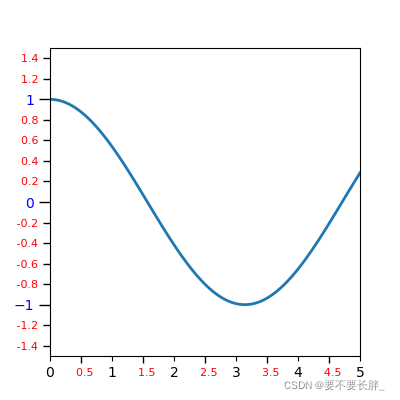
1.3 绘制刻度的网格线
为了更直观的看出图形子某些点的取值,可以给图形加上网格线,以下代码增加了主刻度的网格线,以蓝色虚线表示
import matplotlib.pyplot as plt
import numpy as np
from matplotlib.ticker import AutoMinorLocator,MultipleLocator,FormatStrFormatter
x=np.linspace(0,5,100)
y=np.cos(x)
fig=plt.figure(figsize=(4,4))
ax=fig.add_subplot(111)

ax.set_xlim(0,5)
ax.set_ylim(-1.5,1.5)
ax.xaxis.set_major_locator(MultipleLocator(1)) #将主刻度设为1的倍数
ax.yaxis.set_major_locator(MultipleLocator(1))
ax.xaxis.set_minor_locator(AutoMinorLocator(2))
ax.yaxis.set_minor_locator(AutoMinorLocator(5))

ax.xaxis.set_minor_formatter(FormatStrFormatter('%5.1f')) #设置x轴
最低0.47元/天 解锁文章


 882
882


 被折叠的 条评论
为什么被折叠?
被折叠的 条评论
为什么被折叠?
 到【灌水乐园】发言


