


 本文探讨了欧氏距离与马氏距离的区别,特别是在处理多变量正态分布数据时。马氏距离考虑了不同变量的方差和协方差,因此在评估观测值相对于分布中心的距离时更为准确。它将数据转换为标准无相关形式,并计算变换后的欧几里得距离。对于非球形分布的数据集,马氏距离比欧氏距离更能反映观测值属于某一类别的概率。
http://repository.cmu.edu/cgi/viewcontent.cgi?article=1447&context=robotics
1. Euclidean distance
2. Mahalanobis distance
Please refer to the following explenation as well as the attached file which is even clearer

Distance is not always what it seems
You can generalize these ideas to the multivariate normal distribution.The following graph shows simulated bivariate normal data that is overlaid withprediction ellipses. The ellipses in the graph are the 10% (innermost), 20%, ..., and 90% (outermost) prediction ellipses for the bivariate normal distribution that generated the data. The prediction ellipses are contours of the bivariate normal density function. The probability density is high for ellipses near the origin, such as the 10% prediction ellipse. The density is low for ellipses are further away, such as the 90% prediction ellipse.
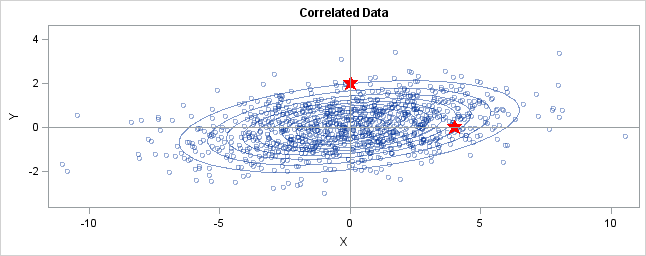
In the graph, two observations are displayed by using red stars as markers. The first observation is at the coordinates (4,0), whereas the second is at (0,2). The question is: which marker is closer to the origin? (The origin is the multivariate center of this distribution.)
The answer is, "It depends how you measure distance." The Euclidean distances are 4 and 2, respectively, so you might conclude that the point at (0,2) is closer to the origin. However, for this distribution, the variance in the Y direction is less than the variance in the X direction, so in some sense the point (0,2) is "more standard deviations" away from the origin than (4,0) is.</p
Notice the position of the two observations relative to the ellipses. The point (0,2) is located at the 90% prediction ellipse, whereas the point at (4,0) is located at about the 75% prediction ellipse. What does this mean? It means that the point at (4,0) is "closer" to the origin in the sense that you are more likely to observe an observation near (4,0) than to observe one near (0,2). The probability density is higher near (4,0) than it is near (0,2).
In this sense, prediction ellipses are a multivariate generalization of "units of standard deviation." You can use the bivariate probability contours to compare distances to the bivariate mean. A pointp is closer than a pointq if the contour that contains p is nested within the contour that containsq.
Defining the Mahalanobis distance
You can use the probability contours to define the Mahalanobis distance.The Mahalanobis distance has the following properties:
- It accounts for the fact that the variances in each direction are different.
- It accounts for the covariance between variables.
- It reduces to the familiar Euclidean distance for uncorrelated variables with unit variance.
For univariate normal data, the univariate z-score standardizes the distribution (so that it has mean 0 and unit variance) and gives a dimensionless quantity that specifies the distance from an observation to the mean in terms of the scale of the data. For multivariate normal data with mean μ and covariance matrix Σ, you can decorrelate the variables and standardize the distribution by applyin
 最低0.47元/天 解锁文章


 3809
3809

 被折叠的 条评论
为什么被折叠?
被折叠的 条评论
为什么被折叠?
 到【灌水乐园】发言


