


 本文介绍如何使用RStudio的内置调试工具来理解代码并查找错误。包括设置断点、查看运行时环境、使用调试命令等高级功能。
Overview
RStudio includes a visual debugger that can help you understand code and find bugs. The debugger includes the following features:
- Editor breakpoints, both inside and outside functions
- Code and local environment visualization during debugging
- Debug stepping tools (next, continue, etc.)
- Deep integration with traditional R debugging tools, such as
browser()anddebug()
Setting editor breakpoints
The simplest way to invoke the debugger is to set a breakpoint. You can set a breakpoint in R code by clicking to the left of the line number in an R script, or pressing Shift+F9.
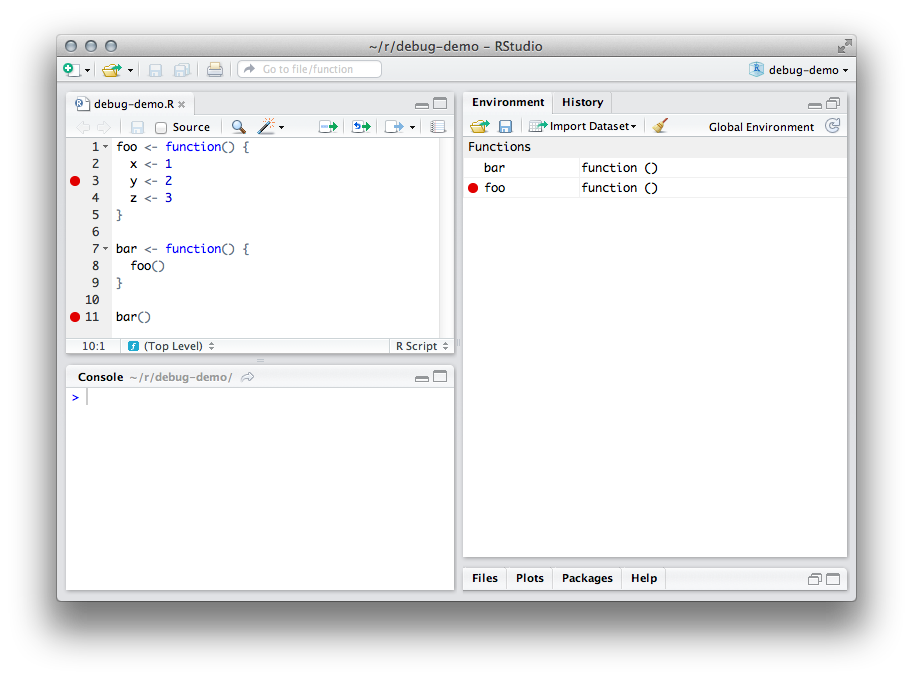
Breakpoints can be set both inside and outside functions. When a breakpoint is set inside a function, it will be hit whenever the function is executed; when a breakpoint is set outside a function, it will be hit only when the file containing the line is sourced.
The file needs to be both saved and sourced in order for RStudio line up running code with the code in your file. RStudio will show you a warning if you need to save and/or source your file to activate a breakpoint.
If you have trouble setting and hitting breakpoints, see Breakpoint Troubleshooting.
Debug mode
When RStudio encounters a breakpoint, it will enter debug mode.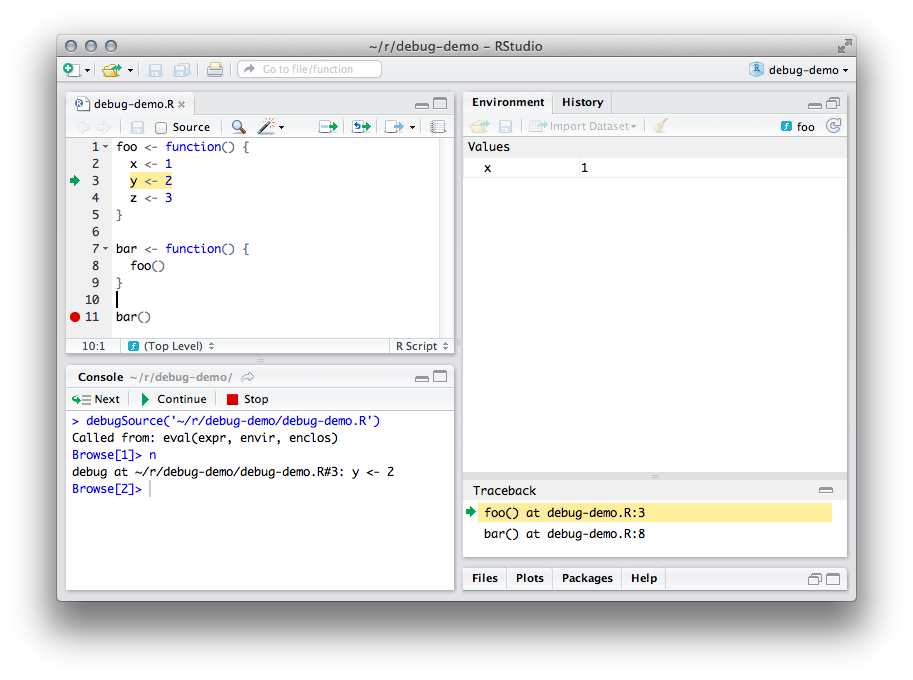
Environment pane
The environment pane shows the local environment of the function as it runs. In this case, the pane is showing the local environment offoo()
. The expression
x <- 1
has just been evaluated, so the object
x
is now listed.
Source window
The source window highlights the expression that's about to be evaluated; in this case, it'sy <- 2
.
Console
The R console window shows a toolbar in debug mode. The toolbar commands:-
Next (F10)
- Execute just the current (highlighted) expression, then pause. Continue (Shift+F5)
- Execute until a breakpoint is encountered. Stop (Shift+F8)
- Stop running the code and leave debug mode.
Browse[N]>
prompt is a normal R prompt with a few special commands available (
reference
). Expressions entered at the prompt are evaluated in the environment of the function currently executing, so you can use the prompt to modify the function's environment or test the value of expressions.
Traceback pane
The traceback pane shows the list of the functions that are currently running, with the most recent function on top. Click any function in the pane to see the expression currently being evaluated in the function and the function's local environment.
NOTE: Clicking on a function in the Traceback pane does not change the environment in the console. Expressions entered in the console will always be evaluated in the context of the currently executing function (marked with a green arrow in the Traceback pane).
Debugging and package development
Breakpoints can be set in package code just as they can in free-standing R code. The primary difference is that you'll need to have an up-to-date build of your package in order to set breakpoints. If your package build isn't up to date, RStudio will warn you when you try to set a breakpoint.
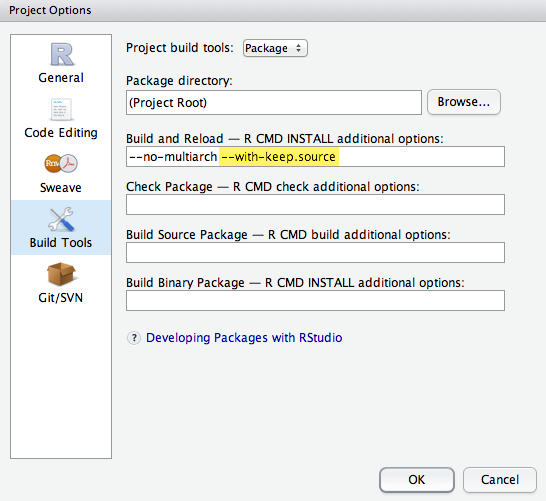
In order to debug effectively in your package, you'll also want to ensure that you package is compiled with the --with-keep.source option. This option is the default for new packages in RStudio; if you need to set it manually, it can be found in Tools -> Project Options -> Build Tools.
When a breakpoint is set in a file inside a package, RStudio will automatically disable the breakpoint when the package is unloaded and enable the breakpoint when the package is loaded. If you're having trouble setting breakpoints in a package, make sure that the package was compiled with source information as described above and that its build is up-to-date.
Advanced: Using the debugger with R debugging commands
RStudio enters debug mode whenever it encounters an interactive browser. There are times when you may wish to debug in code that cannot contain breakpoints, or you may need more advanced behavior, such as conditional breakpoints.
In these cases, you can use R debugging utilities to cause the interactive browser to be invoked at the desired time; once the browser is invoked, RStudio's debugging tools will become available.
-
Conditional breakpoints
-
The
browser()command ( reference) can be inserted anywhere to create a breakpoint. The command can be wrapped in anifstatement to make a conditional breakpoint; for instance:if (x == 0) browser().
Codeless breakpoints
-
The commands
debug()anddebugonce()( reference) can be used to set a breakpoint whenever a function is executed. This makes it possible to set breakpoints in functions for which source files are not readily available.
Error breakpoints
-
It is sometimes useful to invoke the debugger when an error occurs. To do this, have R invoke a browser on error by setting
options(error = browser). This may have undesirable side effects, since it will invoke a browser on every error regardless of origin; consider enabling it only for the duration of your debug session.


 9291
9291

 被折叠的 条评论
为什么被折叠?
被折叠的 条评论
为什么被折叠?
 到【灌水乐园】发言


