1.首先要绘制一个简单的直方图
import numpy as np
import matplotlib.pyplot as plt
from matplotlib import mlab
from matplotlib import rcParams
fig1 = plt.figure(2)
rects =plt.bar(left = (0.2,1),height = (1,0.5),width = 0.2,align="center",yerr=0.000001)
plt.title('Pe')
plt.show()
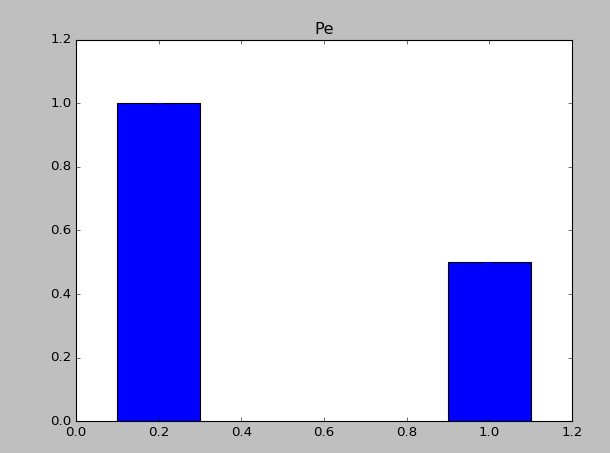
1.1 上面中rects =plt.bar(left = (0.2,1),height = (1,0.5),width = 0.2,align=”center”,yerr=0.000001)这句代码是最重要的,其中left表示直方图的开始的位置(也就是最左边的地方),height是指直方图的高度,当直方图太粗时,可以通过width来定义直方图的宽度,注意多个直方图要用元组,yerr这个参数是防止直方图触顶。
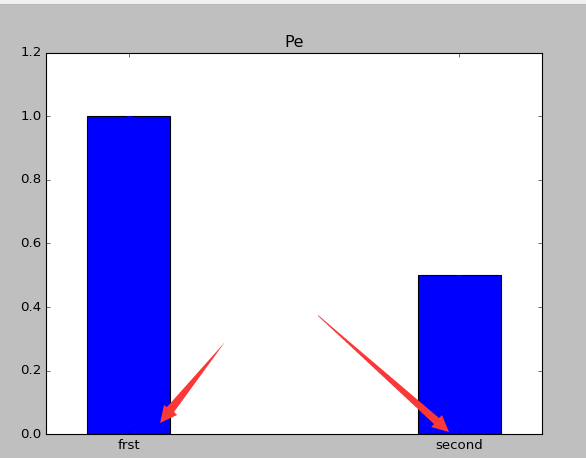
2. 增加直方图脚注
import numpy as np
import matplotlib.pyplot as plt
from matplotlib import mlab
from matplotlib import rcParams
fig1 = plt.figure(2)
rects =plt.bar(left = (0.2,1),height = (1,0.5),width = 0.2,align="center",yerr=0.000001)
plt.title('Pe')
plt.xticks((0.2,1),('frst','second'))
plt.show()
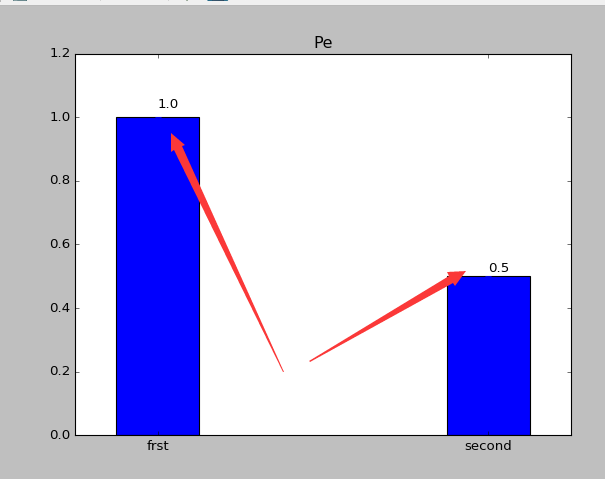
3.直方图上显示具体的数字(自动编号)
import numpy as np
import matplotlib.pyplot as plt
from matplotlib import mlab
from matplotlib import rcParams
fig1 = plt.figure(2)
rects =plt.bar(left = (0.2,1),height = (1,0.5),width = 0.2,align="center",yerr=0.000001)
plt.title('Pe')
def autolabel(rects):
    for rect in rects:
        height = rect.get_height()
        plt.text(rect.get_x()+rect.get_width()/2., 1.03*height, '%s' % float(height))
autolabel(rects)
plt.xticks((0.2,1),('frst','second'))
plt.show()
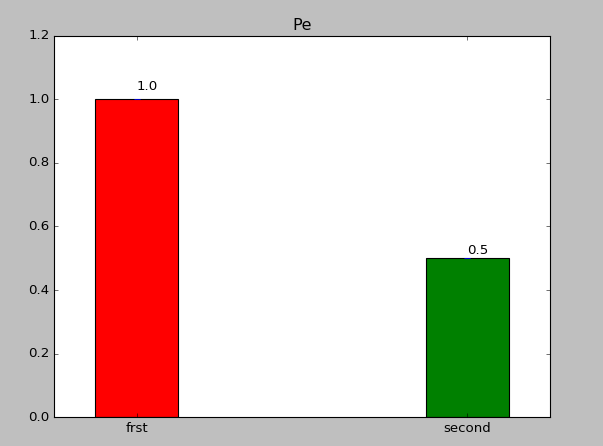
4.改变直方图颜色
import numpy as np
import matplotlib.pyplot as plt
from matplotlib import mlab
from matplotlib import rcParams
fig1 = plt.figure(2)
rects =plt.bar(left = (0.2,1),height = (1,0.5),color=('r','g'),width = 0.2,align="center",yerr=0.000001)
plt.title('Pe')
def autolabel(rects):
    for rect in rects:
        height = rect.get_height()
        plt.text(rect.get_x()+rect.get_width()/2., 1.03*height, '%s' % float(height))
autolabel(rects)
plt.xticks((0.2,1),('frst','second'))
plt.show()
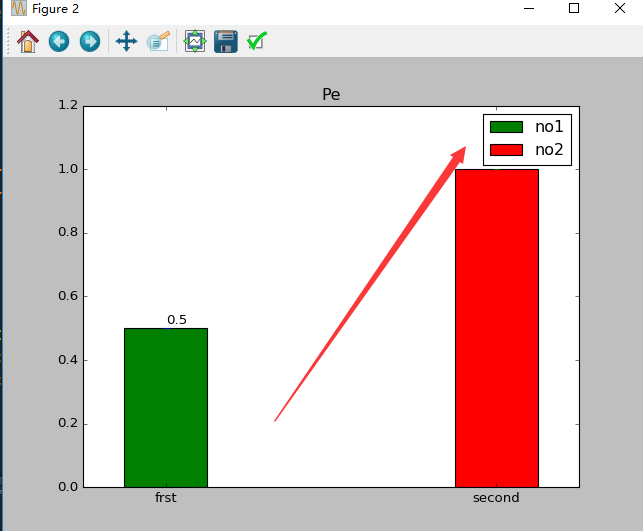
5.添加图注
import numpy as np
import matplotlib.pyplot as plt
from matplotlib import mlab
from matplotlib import rcParams
fig1 = plt.figure(2)
rects1 =plt.bar(left = (0.2),height = (0.5),color=('g'),label=(('no1')),width = 0.2,align="center",yerr=0.000001)
rects2 =plt.bar(left = (1),height = (1),color=('r'),label=(('no2')),width = 0.2,align="center",yerr=0.000001)
plt.legend()
plt.xticks((0.2,1),('frst','second'))
plt.title('Pe')

def autolabel(rects):
    for rect in rects:
        height = rect.get_height()
        plt.text(rect.get_x()+rect.get_width()/2., 1.03*height, '%s' % float(height))
autolabel(rects1)
autolabel(rects2)
plt.show()
6大家根据自己的需要自己来绘制自己的直方图
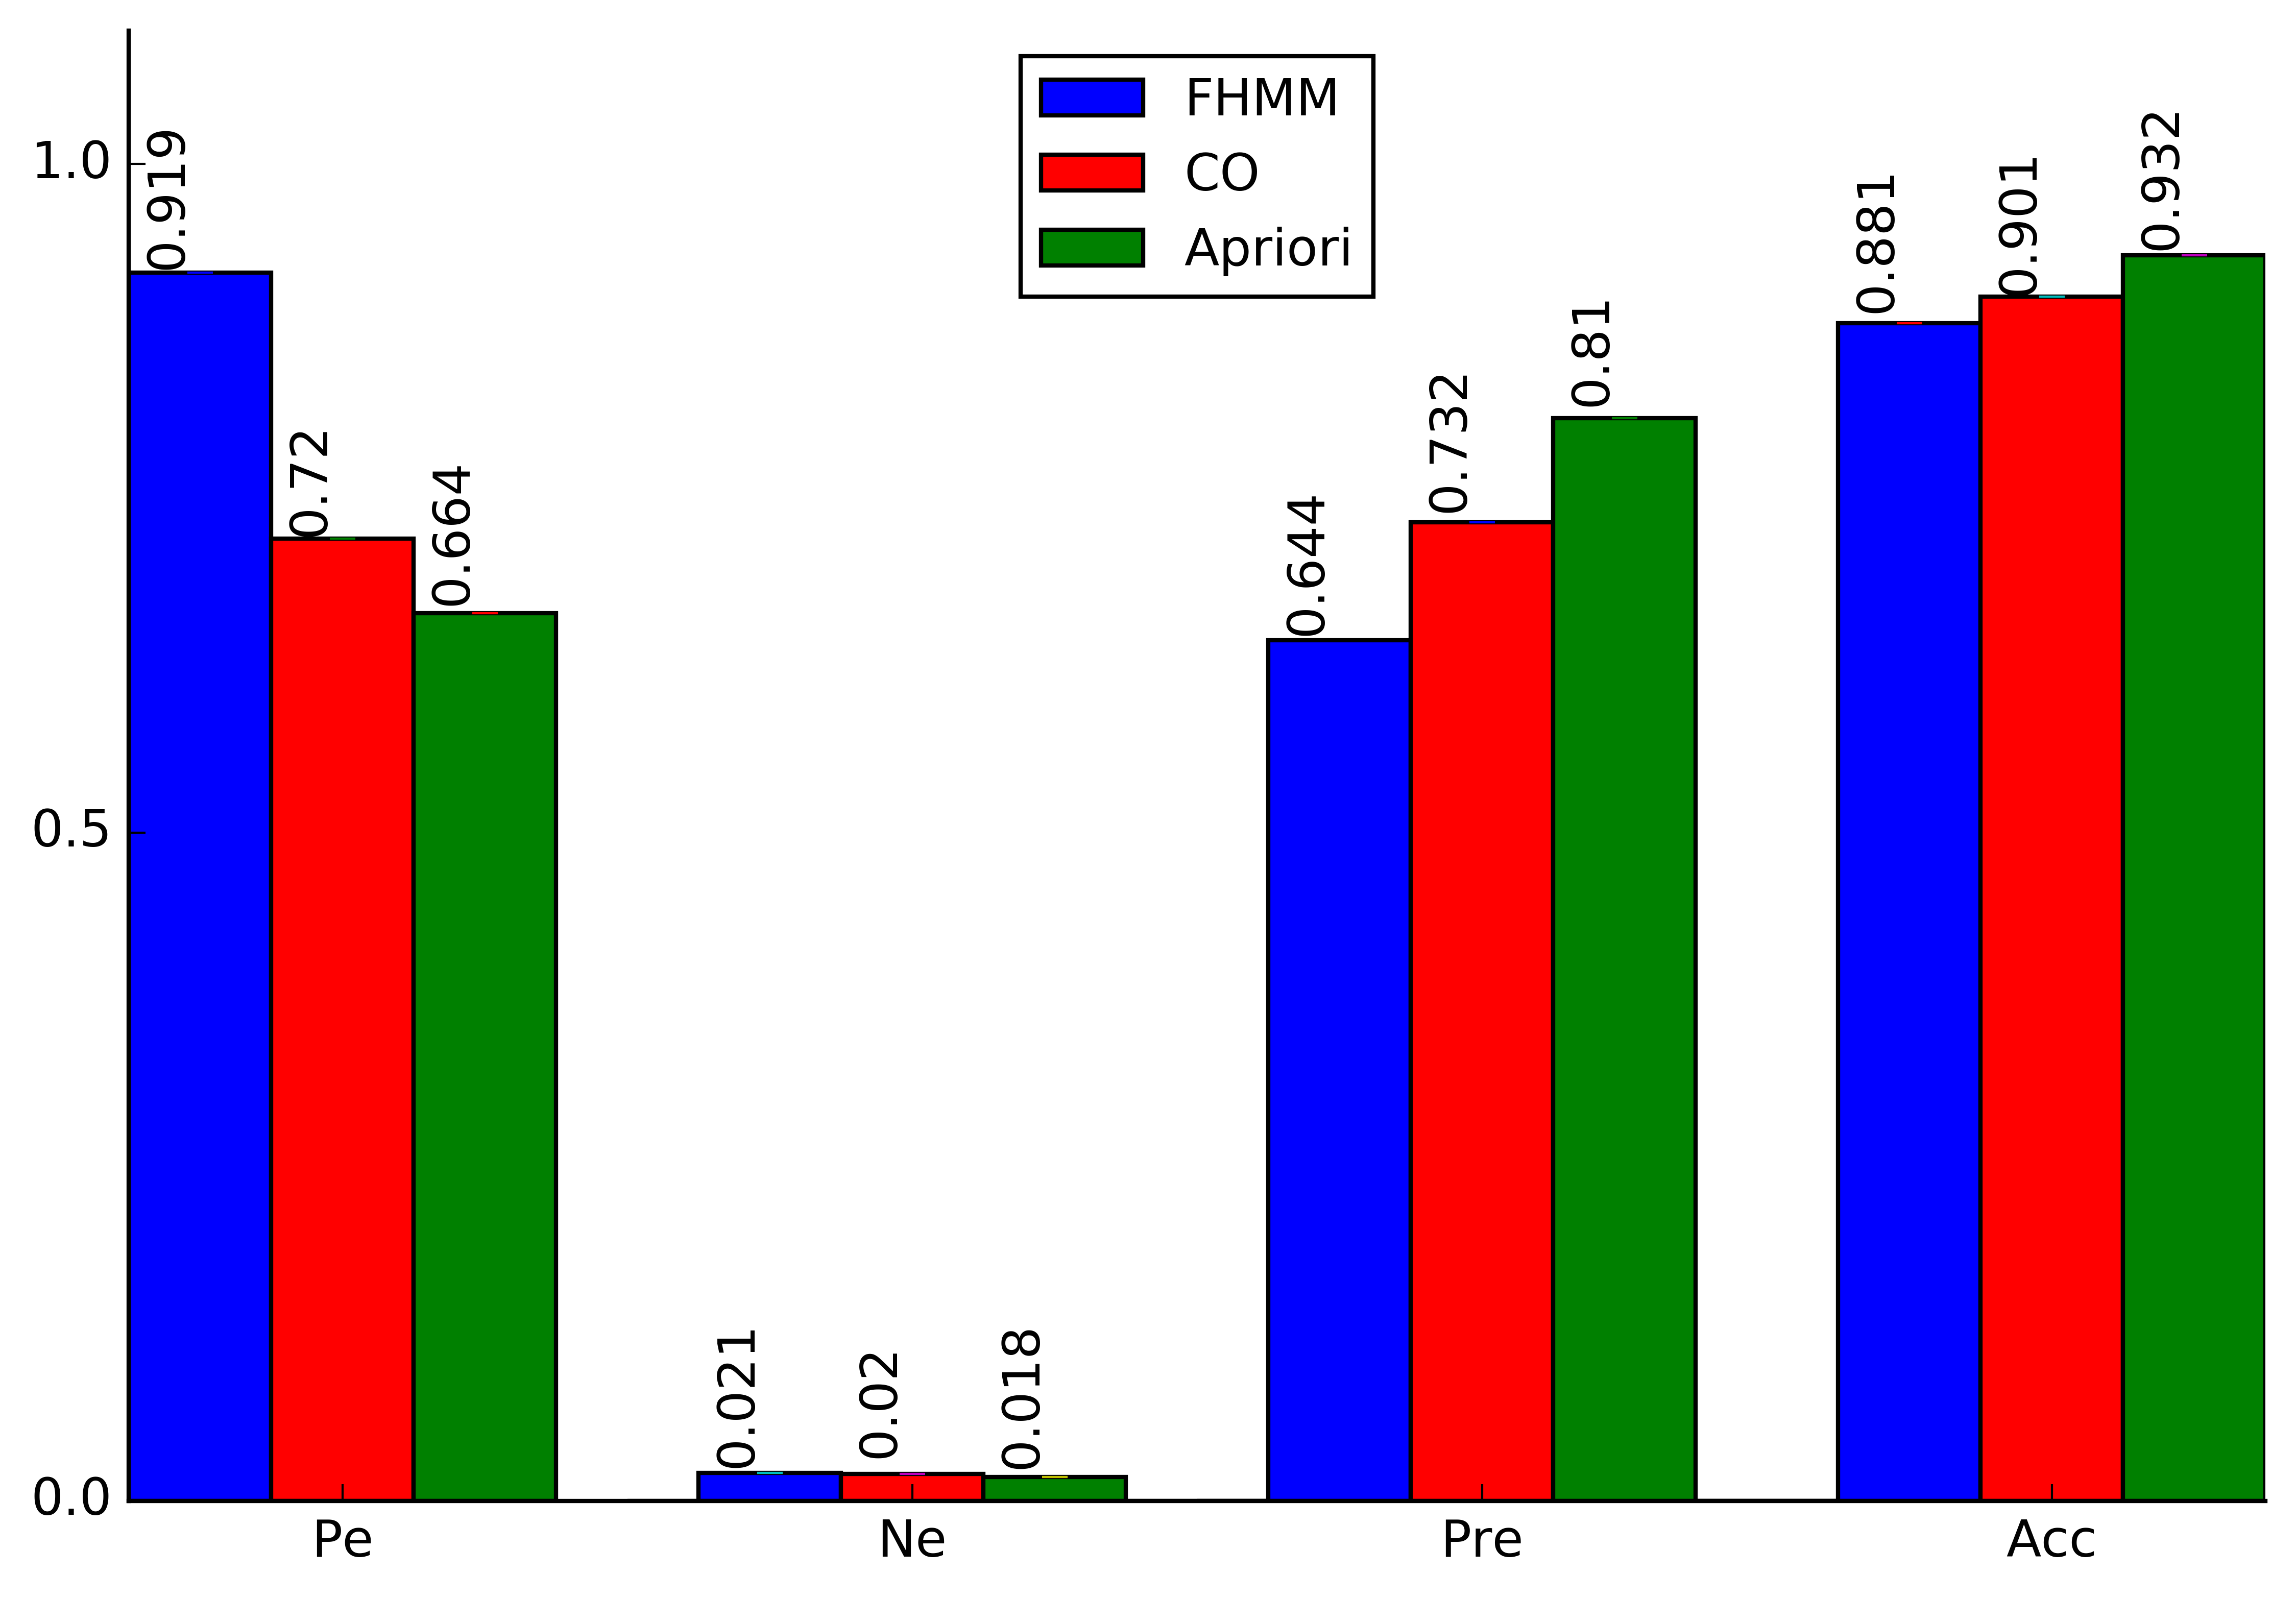
下面回答网友提问,如何画在直方图上垂直显示数据:
下面这个函数是用来垂直显示的,其中设置角度就可以以任意方式来显示。
def autolabel(rects,Num=1.12,rotation1=90,NN=1):
        for rect in rects:
            height = rect.get_height()
            plt.text(rect.get_x()-0.04+rect.get_width()/2., Num*height, '%s' % float(height*NN),rotation=rotation1)
调用方式如下
rects1 =plt.bar(left = (0.05),height = (Pe_FH),color=('b'),label=('FHMM'),width = 0.1,align="center",yerr=0.000001);
autolabel(rects1,1.09);
下面是效果图
专注于AR的在移动端的实现,如果你还有问题没解决,你可以加入我们一起交流。或是关注我们的技术公众号,这是提供技术干货的地方,你有干货可以向我们推荐。

如果你觉得写的不错,对你有用,请在下面点个 顶 支持一下,有问题可以在下面留言评论。


 4009
4009


 被折叠的 条评论
为什么被折叠?
被折叠的 条评论
为什么被折叠?
 到【灌水乐园】发言


