


💥💥💞💞欢迎来到本博客❤️❤️💥💥
🏆博主优势:🌞🌞🌞博客内容尽量做到思维缜密,逻辑清晰,为了方便读者。
⛳️座右铭:行百里者,半于九十。
📋📋📋本文目录如下:🎁🎁🎁
目录
💥1 概述
摘要:居住负荷预测在电力系统的高效运营和规划中起着至关重要的作用。本研究提出了一种基于多元相关-时空图神经网络(MCT-GNN)的短期居住负荷预测方案。MCT-GNN模型利用图神经网络和多元相关学习捕捉居住负荷数据中复杂的时空相关性。该方案在真实居住负荷数据集上进行了评估,结果表明它在准确性和鲁棒性方面优于传统的预测方法。MCT-GNN模型在短期居住负荷预测应用方面具有良好的潜力,并可以为智能电网技术的发展做出贡献。
短期居住负荷预测是城市能源管理和规划中的重要问题,而多元相关-时空图神经网络是一种强大的预测模型,可以有效地处理时空数据。本研究旨在基于多元相关-时空图神经网络,对短期居住负荷进行准确预测。
首先,我们将收集城市中不同居住区域的能源消耗数据,并结合时空信息,构建多元相关的数据集。然后,我们将设计一个时空图神经网络模型,以捕捉不同区域之间的时空关联性,并结合多元相关分析,提高模型的预测能力。
在模型训练阶段,我们将利用历史数据对模型进行训练,并结合交叉验证等方法对模型进行验证和调优。最后,我们将使用测试数据对模型进行评估,并与其他常用的预测模型进行比较分析,以验证多元相关-时空图神经网络在短期居住负荷预测中的有效性和优越性。
通过本研究,我们期望能够为城市能源管理和规划提供一种有效的短期居住负荷预测方法,为城市能源消耗的合理调度和规划提供科学依据。
📚2 运行结果
rmse, mae = [], []

predicted_load = model.predict([testX, ad12, ad22])
predicted_load = predicted_load * (max_value-min_value)+min_value
predicted_load[predicted_load < 0] = 0
var = pd.DataFrame(predicted_load)
var.to_csv(r'/results/predicted load.csv', index=False, header=False)
real_load = testY * (max_value-min_value)+min_value
var2 = pd.DataFrame(real_load)
var2.to_csv(r'/results/real load.csv', index=False, header=False)

print(np.shape(predicted_load))
print(np.shape(real_load))
for i in range(20):
    rmse.append(math.sqrt(mean_squared_error(predicted_load[:, i], real_load[:, i])))
    mae.append(mean_absolute_error(predicted_load[:, i], real_load[:, i]))

print(rmse)
print(mae)

print("-------------------------------------------------------------------")
print("Root Mean Square Error:" + str(mean(rmse)))
print("Mean Absolute Error:" + str(mean(mae)))

plt.plot(real_load[:, 0], color='red', label='real_load')
plt.plot(predicted_load[:, 0], color='blue', label='Predicted load')
plt.title('load Prediction')
plt.xlabel('Time')
plt.ylabel('load')
plt.legend()
plt.savefig('/results/curve.png')
plt.show()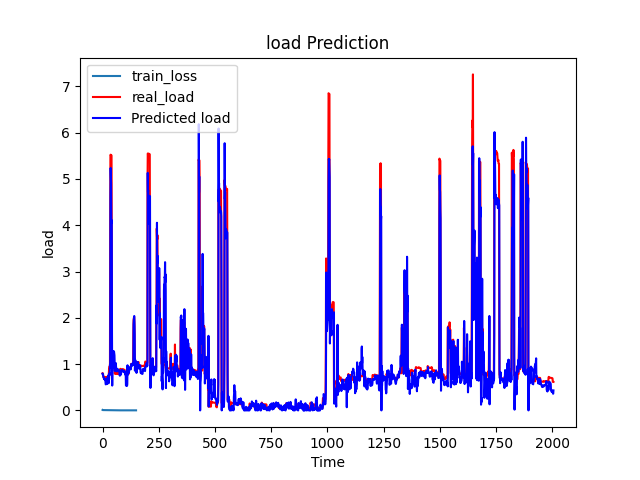
运行结果及数据:
rmse, mae = [], []

predicted_load = model.predict([testX, ad12, ad22])
predicted_load = predicted_load * (max_value-min_value)+min_value
predicted_load[predicted_load < 0] = 0
var = pd.DataFrame(predicted_load)
var.to_csv(r'/results/predicted load.csv', index=False, header=False)
real_load = testY * (max_value-min_value)+min_value
var2 = pd.DataFrame(real_load)
var2.to_csv(r'/results/real load.csv', index=False, header=False)

print(np.shape(predicted_load))
print(np.shape(real_load))
for i in range(20):
    rmse.append(math.sqrt(mean_squared_error(predicted_load[:, i], real_load[:, i])))
    mae.append(mean_absolute_error(predicted_load[:, i], real_load[:, i]))

print(rmse)
print(mae)

print("-------------------------------------------------------------------")
print("Root Mean Square Error:" + str(mean(rmse)))
print("Mean Absolute Error:" + str(mean(mae)))

plt.plot(real_load[:, 0], color='red', label='real_load')
plt.plot(predicted_load[:, 0], color='blue', label='Predicted load')
plt.title('load Prediction')
plt.xlabel('Time')
plt.ylabel('load')
plt.legend()
plt.savefig('/results/curve.png')
plt.show()
🎉3 参考文献
文章中一些内容引自网络,会注明出处或引用为参考文献,难免有未尽之处,如有不妥,请随时联系删除。
[1] Lin W , Wu D , Boulet B .Spatial-Temporal Residential Short-Term Load Forecasting via Graph Neural Networks[J].IEEE transactions on smart grid, 2021(12-6).DOI:10.1109/TSG.2021.3093515.
[2] Peng Q , Liu Z W .Short-Term Residential Load Forecasting Based on Smart Meter Data Using Temporal Convolutional Networks[C]//2020 39th Chinese Control Conference (CCC).0[2023-11-09].DOI:10.23919/CCC50068.2020.9188453.


 931
931


 被折叠的 条评论
为什么被折叠?
被折叠的 条评论
为什么被折叠?
 到【灌水乐园】发言


