


 本文介绍了如何使用Python和Pyecharts库从CSV文件中读取数据,将数据转换为字典,按GDP排序生成动态柱状图,并创建时间线展示全球GDP随时间的变化。
一、获取数据
数据格式为(一小部分):
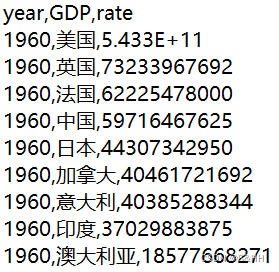
f = open("E:\\code\\python\\资料\\可视化案例数据\\动态柱状图数据\\1960-2019全球GDP数据.csv", "r", encoding="GB2312")
# 一次读取一行,内容放到列表中,每一行为一个元素
data = f.readlines()
f.close()
二、把数据放入字典中,便于后续处理数据
data.pop(0)  # 去掉第一行的标题信息
# 把数据转换为字典存储
data_dict = {}  # 字典内的数据为:{年份,[[美国,1],[中国,2],[日本,3]]},对应的value是列表
for i in data:
    time = int(i.split(",")[0])#把年份设置为整数
    country = i.split(",")[1]
    gdp = float(i.split(",")[2])#由于数据中过大的数据采用科学计数法,可以转换为float来统一格式
    # 如果字典中没有对应的键,则执行data_dict[time]时会出现KeyError的错误
    # 刚开始时字典为空,对异常进行捕获,捕获后添加相应的键和值
    try:
        data_dict[time].append([country, gdp])  # data_dict[time]对应的是一个列表,可以调用append进行添加元素
    except KeyError:
        data_dict[time] = []  # 添加一个空的键值对
        data_dict[time].append([country, gdp])  # 再进行值的添加
三、根据GDP的大小对字典中值的内容进行排序,并为每一个年份都创建一个柱形图
# 按照从小到大的顺序获取字典中的年份
data_dict_year = data_dict.keys()
bar_sum = []
for year in data_dict_year:
# 对每个年份对应的国家按照gdp从大到小排序
data_dict[year].sort(key=lambda element: element[1], reverse=True)
bar_data_name = []
bar_data_gdp = []
# 为了使柱形图中的数据按照从上到下的方式显示,要把添加柱形图的顺序反转(最大值最后添加)
for i in range(7, -1, -1): # 获取gdp总量前八的国家和gdp
bar_data_name.append(data_dict[year][i][0])
bar_data_gdp.append(data_dict[year][i][1])
# 为每个年份分别创建一个柱形图
bar = Bar()
bar.add_xaxis(bar_data_name)
bar.add_yaxis("GDP", bar_data_gdp)
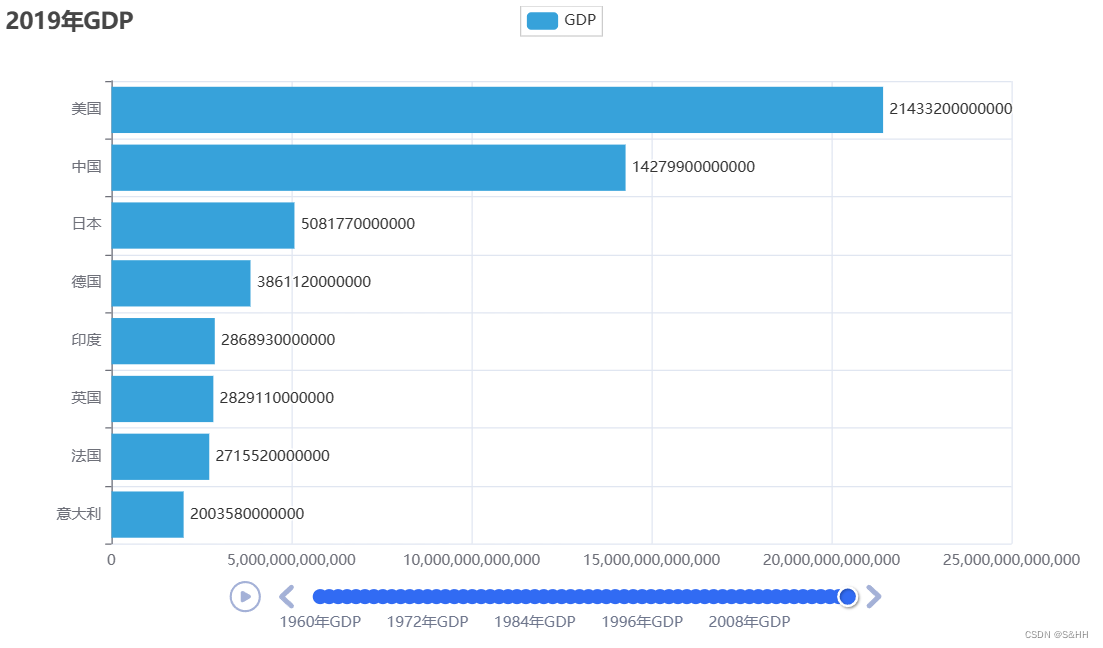
bar.set_global_opts(title_opts=options.TitleOpts(True, f"{year}年GDP"))
bar.set_series_opts( # 设置标签在右侧显示
label_opts=options.LabelOpts(
is_show=True,
position="right"
)
)
bar.reversal_axis()
bar_sum.append(bar)四、创建时间线对象,并对时间线进行参数设置
# 创建时间线对象
timeline = Timeline({"theme": ThemeType.LIGHT})
temp_year = 1960
for i in bar_sum:
    timeline.add(i, f"{temp_year}年GDP")
    temp_year = temp_year + 1
timeline.add_schema(
    play_interval=400,  # 自动播放时间间隔(单位为:s)
    is_timeline_show=True,  # 在自动播放的时候显示时间线
    is_auto_play=True,  # 是否自动播放
    is_loop_play=False  # 是否循环播放
)
timeline.render()
五、效果图
六、完整代码
from pyecharts.charts import Bar, Timeline
from pyecharts.globals import ThemeType
from pyecharts import options

f = open("E:\\code\\python\\资料\\可视化案例数据\\动态柱状图数据\\1960-2019全球GDP数据.csv", "r", encoding="GB2312")
# 一次读取一行,内容放到列表中,每一行为一个元素
data = f.readlines()
f.close()
data.pop(0)  # 去掉第一行的标题信息
# 把数据转换为字典存储
data_dict = {}  # 字典内的数据为:{年份,[[美国,1],[中国,2],[日本,3]]},对应的value是列表
for i in data:
    time = int(i.split(",")[0])
    country = i.split(",")[1]
    gdp = float(i.split(",")[2])
    # 如果字典中没有对应的键,则执行data_dict[time]时会出现KeyError的错误
    # 刚开始时字典为空,对异常进行捕获,捕获后添加相应的键和值
    try:
        data_dict[time].append([country, gdp])  # data_dict[time]对应的是一个列表,可以调用append进行添加元素
    except KeyError:
        data_dict[time] = []  # 添加一个空的键值对
        data_dict[time].append([country, gdp])  # 再进行值的添加

# 按照从小到大的顺序获取字典中的年份
data_dict_year = data_dict.keys()
bar_sum = []
for year in data_dict_year:
    # 对每个年份对应的国家按照gdp从大到小排序
    data_dict[year].sort(key=lambda element: element[1], reverse=True)
    bar_data_name = []
    bar_data_gdp = []
    # 为了使柱形图中的数据按照从上到下的方式显示,要把添加柱形图的顺序反转(最大值最后添加)
    for i in range(7, -1, -1):  # 获取gdp总量前八的国家和gdp
        bar_data_name.append(data_dict[year][i][0])
        bar_data_gdp.append(data_dict[year][i][1])
    # 为每个年份分别创建一个柱形图
    bar = Bar()
    bar.add_xaxis(bar_data_name)
    bar.add_yaxis("GDP", bar_data_gdp)
    bar.set_global_opts(title_opts=options.TitleOpts(True, f"{year}年GDP"))
    bar.set_series_opts(  # 设置标签在右侧显示
        label_opts=options.LabelOpts(
            is_show=True,
            position="right"
        )
    )
    bar.reversal_axis()
    bar_sum.append(bar)
# 创建时间线对象
timeline = Timeline({"theme": ThemeType.LIGHT})
temp_year = 1960
for i in bar_sum:
    timeline.add(i, f"{temp_year}年GDP")
    temp_year = temp_year + 1
timeline.add_schema(
    play_interval=400,  # 自动播放时间间隔
    is_timeline_show=True,  # 在自动播放的时候显示时间线
    is_auto_play=True,  # 是否自动播放
    is_loop_play=False  # 是否循环播放
)
timeline.render()


 704
704

 被折叠的 条评论
为什么被折叠?
被折叠的 条评论
为什么被折叠?
 到【灌水乐园】发言


