


完整代码如下:
import numpy as np
import matplotlib.pyplot as plt

plt.rcParams['font.sans-serif'] = ["SimHei"]

x = [x for x in range(1, 13)]
y1 = [20, 28, 23, 16, 29, 36, 39, 33, 31, 19, 21, 25]
y2 = [17, 22, 39, 26, 35, 23, 25, 27, 29, 38, 28, 20]
labels = ['1 月', '2 月', '3 月', '4 月', '5 月', '6 月', '7月', '8 月', '9 月', '10 月', '11 月', '12 月']

# 绘制第一个子图
ax1 = plt.subplot(211)
ax1.plot(x, y1, 'm--o', lw=2, ms=5, label='产品A')
ax1.plot(x, y2, 'g--o', lw=2, ms=5, label='产品B')
ax1.set_title("产品A 与产品B的销售额", fontsize=11)
ax1.set_ylim(10, 45)
ax1.set_ylabel('销售额(亿元)')
ax1.set_xlabel('月份')
for xy1 in zip(x, y1):
    ax1.annotate("%s" % xy1[1], xy=xy1, xytext=(-5, 5), textcoords='offset points')
for xy2 in zip(x, y2):
    ax1.annotate("%s" % xy2[1], xy=xy2, xytext=(-5, 5), textcoords='offset points')
ax1.legend()

# 绘制第二个子图
ax2 = plt.subplot(223)
ax2.pie(y1, radius=1, wedgeprops={'width': 0.5}, labels=labels, autopct='%3.1f%%', pctdistance=0.75)
ax2.set_title('产品A的销售额 ')

# 绘制第三个子图
ax3 = plt.subplot(224)
ax3.pie(y2, radius=1, wedgeprops={'width': 0.5}, labels=labels, autopct='%3.1f%%', pctdistance=0.75)
ax3.set_title('产品B的销售额 ')

# 调整子图之间的距离
# 需求一: 利用subplot2grid()修改下列代码,使其运行结果如图所示(2行4列)
ax2 = plt.subplot2grid(shape=(2, 4), loc=(1, 0))
ax3 = plt.subplot2grid(shape=(2, 4), loc=(1, 3))
plt.show()
导入库,设置中文
import numpy as np
import matplotlib.pyplot as plt

plt.rcParams['font.sans-serif'] = ["SimHei"]
导入数据
x = [x for x in range(1, 13)]
y1 = [20, 28, 23, 16, 29, 36, 39, 33, 31, 19, 21, 25]
y2 = [17, 22, 39, 26, 35, 23, 25, 27, 29, 38, 28, 20]
labels = ['1 月', '2 月', '3 月', '4 月', '5 月', '6 月', '7月', '8 月', '9 月', '10 月', '11 月', '12 月']
绘制第一个子图,命名为ax1
ax1 = plt.subplot(211)
ax1.plot(x, y1, 'm--o', lw=2, ms=5, label='产品A')
ax1.plot(x, y2, 'g--o', lw=2, ms=5, label='产品B')
ax1.set_title("产品A 与产品B的销售额", fontsize=11)
ax1.set_ylim(10, 45)
ax1.set_ylabel('销售额(亿元)')
ax1.set_xlabel('月份')
for xy1 in zip(x, y1):
    ax1.annotate("%s" % xy1[1], xy=xy1, xytext=(-5, 5), textcoords='offset points')
for xy2 in zip(x, y2):
    ax1.annotate("%s" % xy2[1], xy=xy2, xytext=(-5, 5), textcoords='offset points')
ax1.legend()
绘制第二个子图,ax2
ax2 = plt.subplot(223)
ax2.pie(y1, radius=1, wedgeprops={'width': 0.5}, labels=labels, autopct='%3.1f%%', pctdistance=0.75)
ax2.set_title('产品A的销售额 ')
绘制第三个子图ax3
ax3 = plt.subplot(224)
ax3.pie(y2, radius=1, wedgeprops={'width': 0.5}, labels=labels, autopct='%3.1f%%', pctdistance=0.75)
ax3.set_title('产品B的销售额 ')
调整子图的布局,书上用plt.tight_layout(),但这个已经失效了。
我们用 plt.subplot2grid
ax2 = plt.subplot2grid(shape=(2, 4), loc=(1, 0))
ax3 = plt.subplot2grid(shape=(2, 4), loc=(1, 3))
运行结果如下:
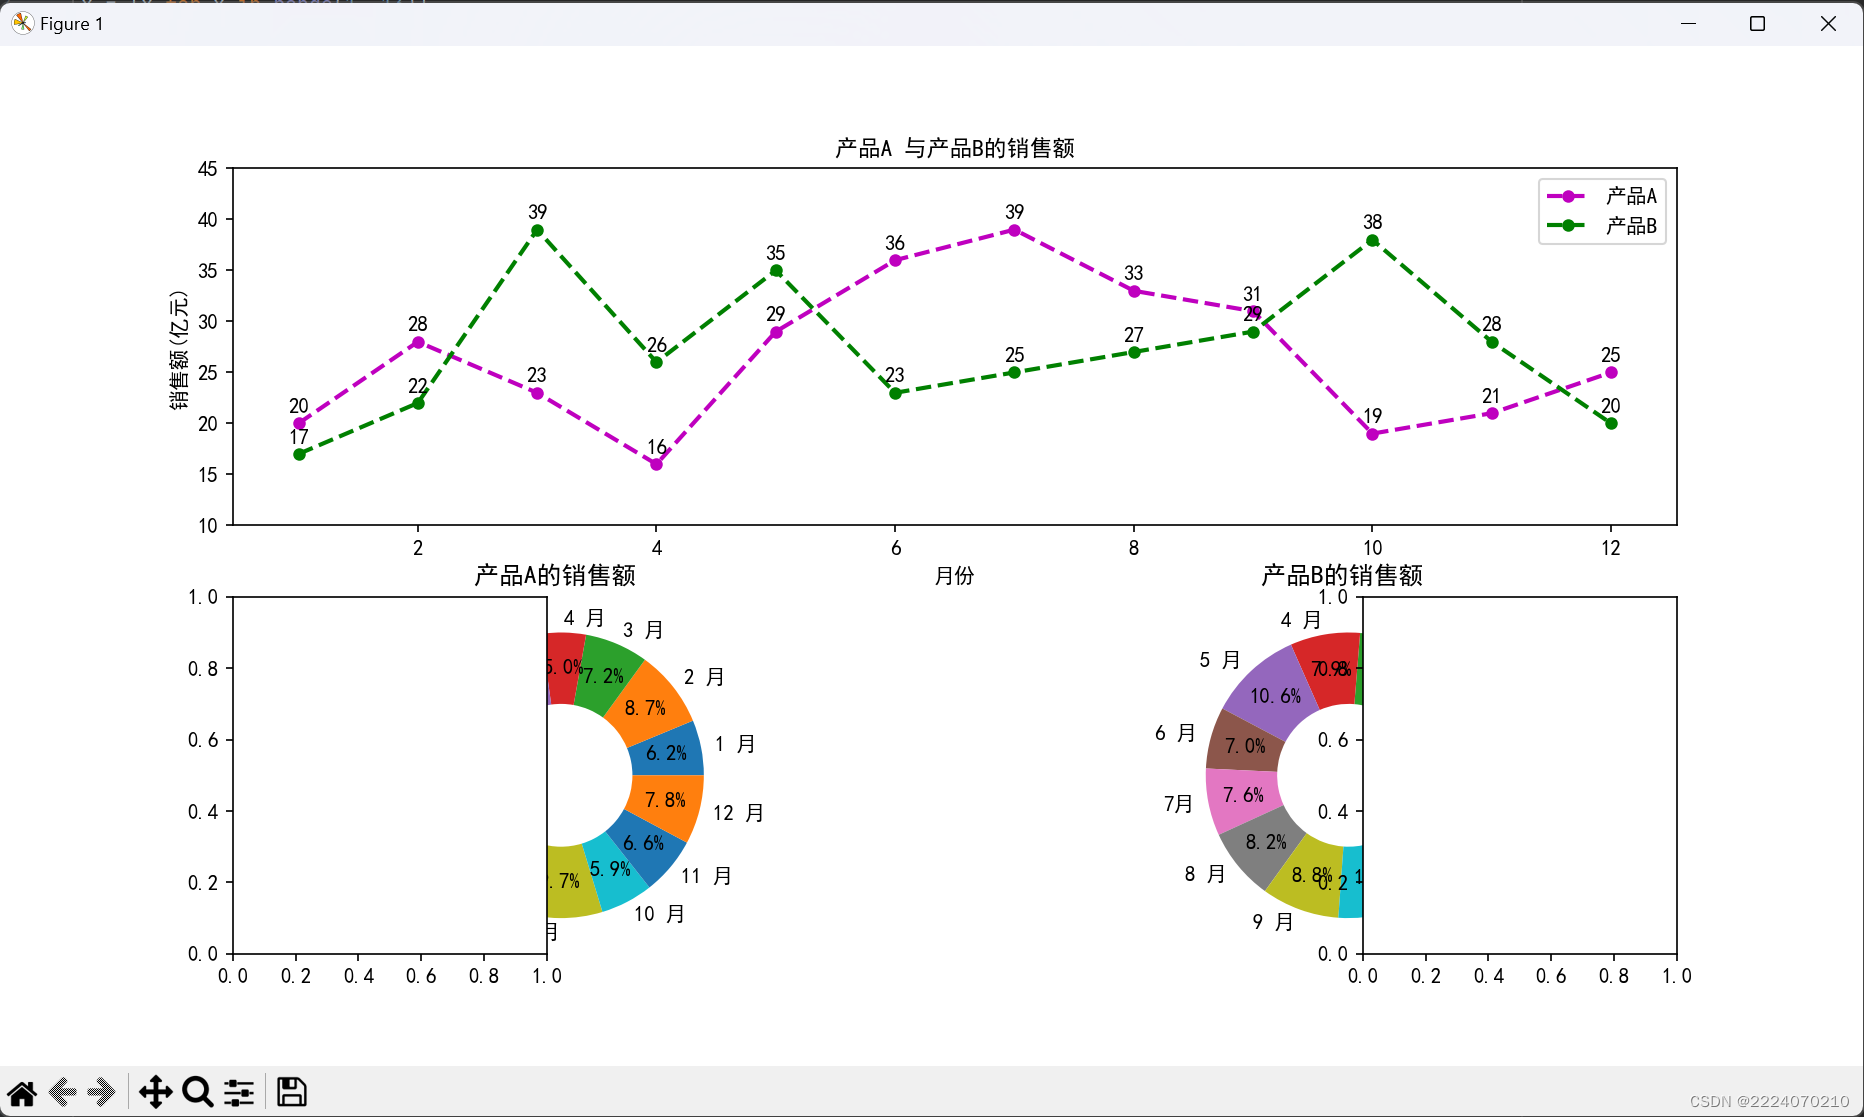
你没看错,就是没做出来。👉👈


 1508
1508


 被折叠的 条评论
为什么被折叠?
被折叠的 条评论
为什么被折叠?
 到【灌水乐园】发言


