


示例一:
x = np.linspace(-1, 1, 100)
print(type(x))
y = x ** 2
plt.figure(1)
plt.subplot(2, 2, 1)
plt.plot(x, y)
plt.subplot(2, 2, 2)
plt.plot(x, y)
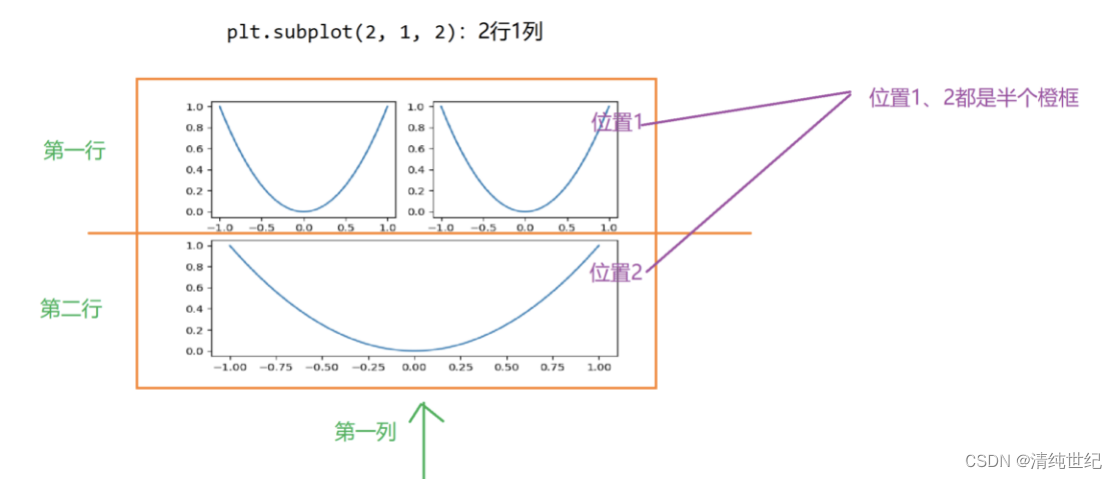
plt.subplot(2, 1, 2)
plt.plot(x, y)
plt.show()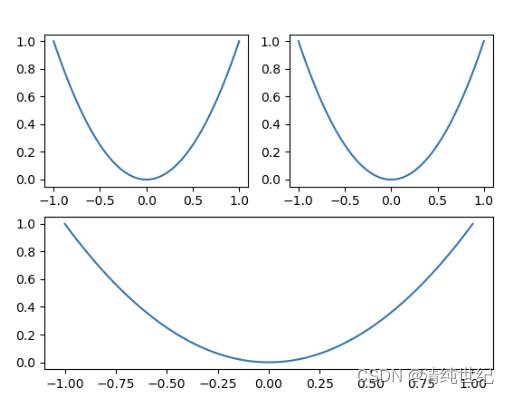
plt.subplot(2, 2, 1):把画布分为2x2,且在1位置。plt.subplot(2, 2, 2):把画布分为2x2,且在2位置。plt.subplot(2, 1, 2):把画布分为2x1,且在2位置。
示例二;
x = np.linspace(-1, 1, 100)
print(type(x))
y = x ** 2
plt.figure(1)

plt.subplot(2, 2, 1)
plt.plot(x, y)

plt.subplot(2, 2, 3)
plt.plot(x, y)

plt.subplot(1, 2, 2)
plt.plot(x, y)

plt.show()
plt.subplot(2, 2, 1):把画布分为2x2,且在第一个位置
plt.subplot(2, 2, 3):把画布分为2x2,且在第三个位置
plt.subplot(1, 2, 2):把画布分为1x2,且在第二个位置
plt.subplot(2, 2, 3):把画布分为2x2,且在第三个位置
plt.subplot(1, 2, 2):把画布分为1x2,且在第二个位置


其他示例:


其他子图示例:
1、下面代码但是不能合并两个子图显示
import matplotlib.pyplot as plt
import numpy as np

# 创建一个2x2的网格
fig, axs = plt.subplots(2, 2)

# 在每个子图中绘制一个图形
for ax in axs.flat:
    # 随机生成一些数据
    x = np.random.rand(100)
    y = np.random.rand(100)
    # 绘制散点图
    ax.scatter(x, y)

# 显示图形
plt.show()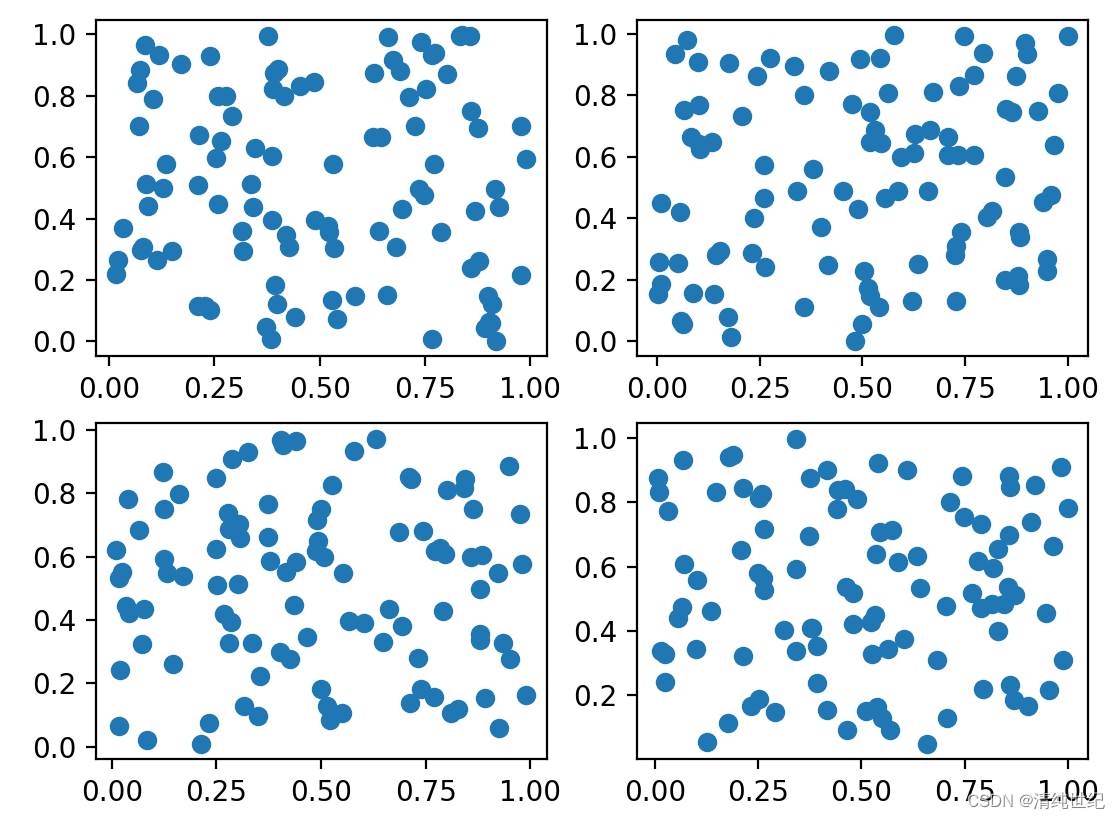
2、可以合并
import matplotlib.gridspec as gridspec
import matplotlib.pyplot as plt
import numpy as np

# 创建一个2x2的网格,第一个子图占据整个第一行,第二个子图占据第一行的后两列
gs = gridspec.GridSpec(2, 2, width_ratios=[1, 2])
ax1 = plt.subplot(gs[0, :])
ax2 = plt.subplot(gs[1, 0])
ax3 = plt.subplot(gs[1, 1])

# 在第一个子图中绘制一个折线图
x = np.linspace(0, 10, 100)
y = np.sin(x)
ax1.plot(x, y)

# 在第二个子图中绘制一个散点图
x = np.random.rand(100)
y = np.random.rand(100)
ax2.scatter(x, y)

# 在第三个子图中绘制一个柱状图
x = ['A', 'B', 'C', 'D']
y = [3, 7, 1, 9]
ax3.bar(x, y)

# 显示图形
plt.show()
3、可以合并
import matplotlib.pyplot as plt
import matplotlib.gridspec as gridspec

fig = plt.figure()

# 定义网格
gs = gridspec.GridSpec(3, 3)

# 创建子图1
ax1 = fig.add_subplot(gs[0, :])
ax1.set_title('Subplot 1')

# 创建子图2
ax2 = fig.add_subplot(gs[1, :2])
ax2.set_title('Subplot 2')

# 创建子图3
ax3 = fig.add_subplot(gs[1:, 2])
ax3.set_title('Subplot 3')

# 创建子图4
ax4 = fig.add_subplot(gs[2, :2])
ax4.set_title('Subplot 4')

# 添加图形
fig.tight_layout()
plt.show()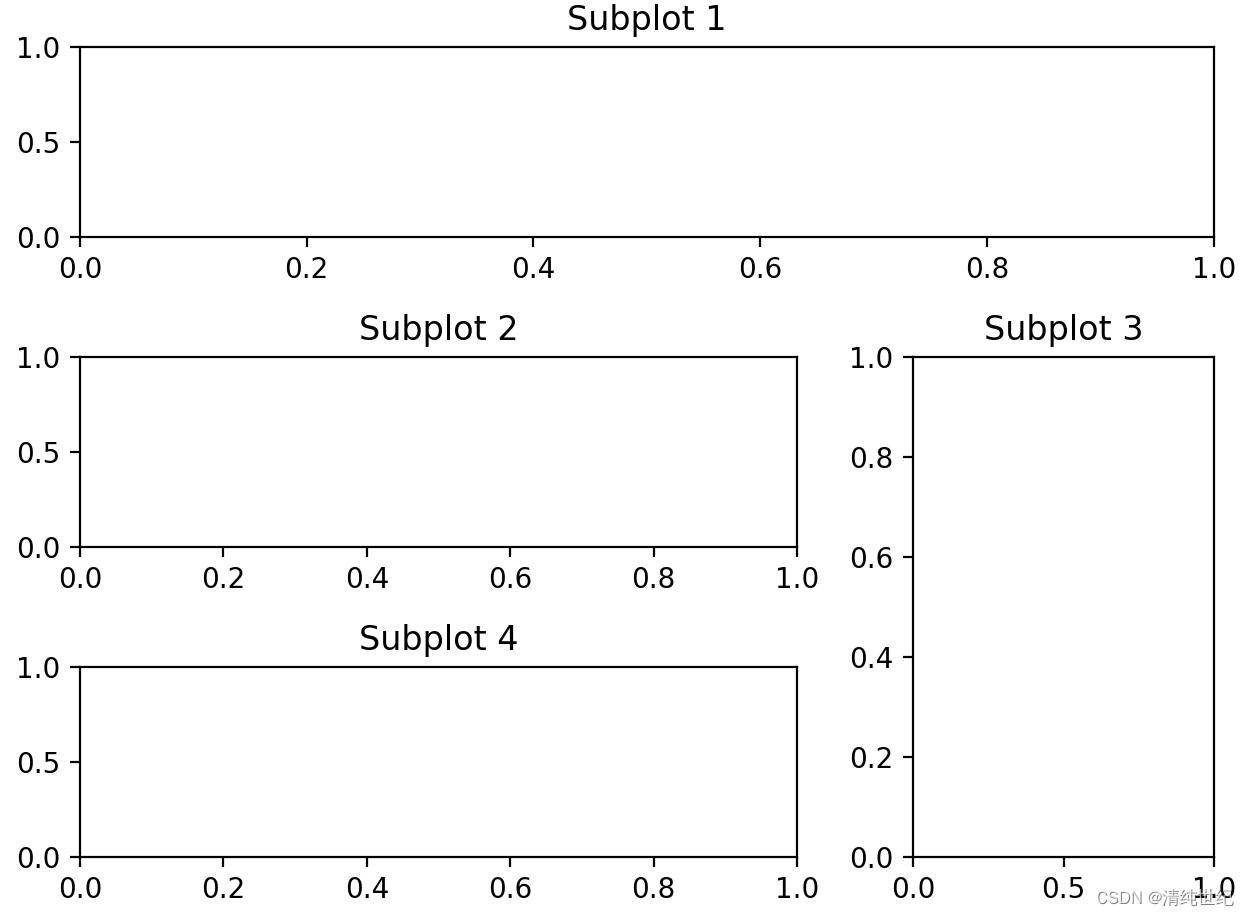
针对上述方法的子图间距调整:
plt.subplots_adjust(wspace=0.4, hspace=-0.3)  # 调整水平和垂直间距,注意在0~1之间
plt.tight_layout(pad=1.08, h_pad=None, w_pad=None) #或者使用自动调整,h_pad是调整高度
还有一种,直接设置图像是靠近边框顶部还是右侧或者左侧显示(如果同时设置了上面两个参数,也需要根据不同参数调整):
import matplotlib.pyplot as plt
import pandas as pd

# 创建一个DataFrame
data = {'Name': ['Alice', 'Bob', 'Charlie', 'David'] * 4}
df = pd.DataFrame(data)

# 转置DataFrame
transposed_df = df.transpose()

# 创建一个示例图形,包含一个子图
fig, ax = plt.subplots()

# 绘制图像
ax.axis('off')  # 关闭边框
ax.table(cellText=transposed_df.values, cellLoc='center', loc='center')

# 设置子图的位置
pos = ax.get_position()
pos.y1 = 0.8  # 调整顶部位置
ax.set_position(pos)

# 显示图形
plt.show()

"""
# 调整左侧位置
pos.x0 = 0.1
# 调整右侧位置
pos.x1 = 0.9
# 调整底部位置
pos.y0 = 0.2
"""


 3294
3294


 被折叠的 条评论
为什么被折叠?
被折叠的 条评论
为什么被折叠?
 到【灌水乐园】发言


