基于ARIMA-CNN-LSTM预测模型研究(Python代码实现)

💥💥💞💞欢迎来到本博客❤️❤️💥💥

🏆博主优势:🌞🌞🌞博客内容尽量做到思维缜密,逻辑清晰,为了方便读者。

⛳️座右铭:行百里者,半于九十。

📋📋📋本文目录如下:🎁🎁🎁

目录

💥1 概述

1.1 ARIMA 模型

1.2 CNN - LSTM 模型

📚2 运行结果

🎉3 参考文献

🌈4 Python代码实现


💥1 概述

文献来源:

1.1 ARIMA 模型

ARIMA 模型由 Box 和 Jenkins 于 20 世纪 70 年代提出,是一种著名的时间序列预测方法,该模型的基本思想是将数据看成一个时间序列对象,再使用数学模型对该时间序列进行描述,训练完成的模型可以通过时间序列的过去值、现在值来预测未来的数据及趋势,在一些工业设备强度预测等问题中得到了广泛的应用。由于实际的水文序列具有非线性非平稳的特点,而 ARIMA 模型引入了差分,对于非线性非平稳的时间序列也具有良好的处理效果,并对水文序列中的线性关系具有良好的学习效果,故本文采用 ARIMA 模型对未来水位变化情况进行预测。

ARIMA 模型由自回归( AR) 模型、移动平均模型( MA) 和差分法( I) 组成,其表达式如下。

自回归( AR) 模型用来描述现值与过去值之间的关系,使用指标自身的数据对自身进行预测。
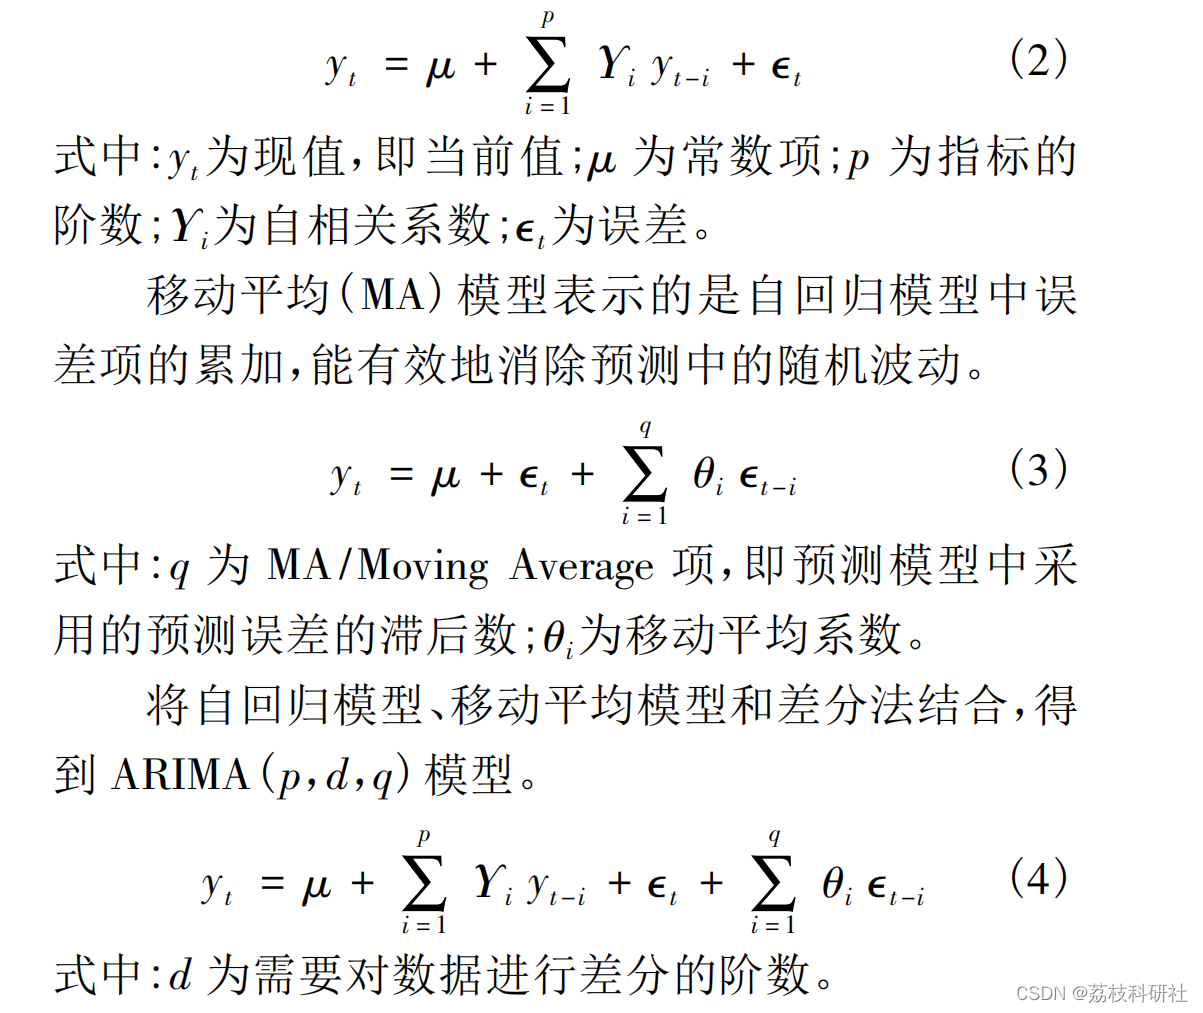
1.2 CNN - LSTM 模型

考虑到影响因素众多,故本文使用了一种基于 CNN - LSTM 的多变量预测模型,将数据的多个变量输入进神经网络模型中,通过 CNN 对数据进行特征提取,其中原理如下。

定义一段水位数据序列为

细胞状态Ct由输入门和遗忘门的变化决定,其表达式如下:


📚2 运行结果

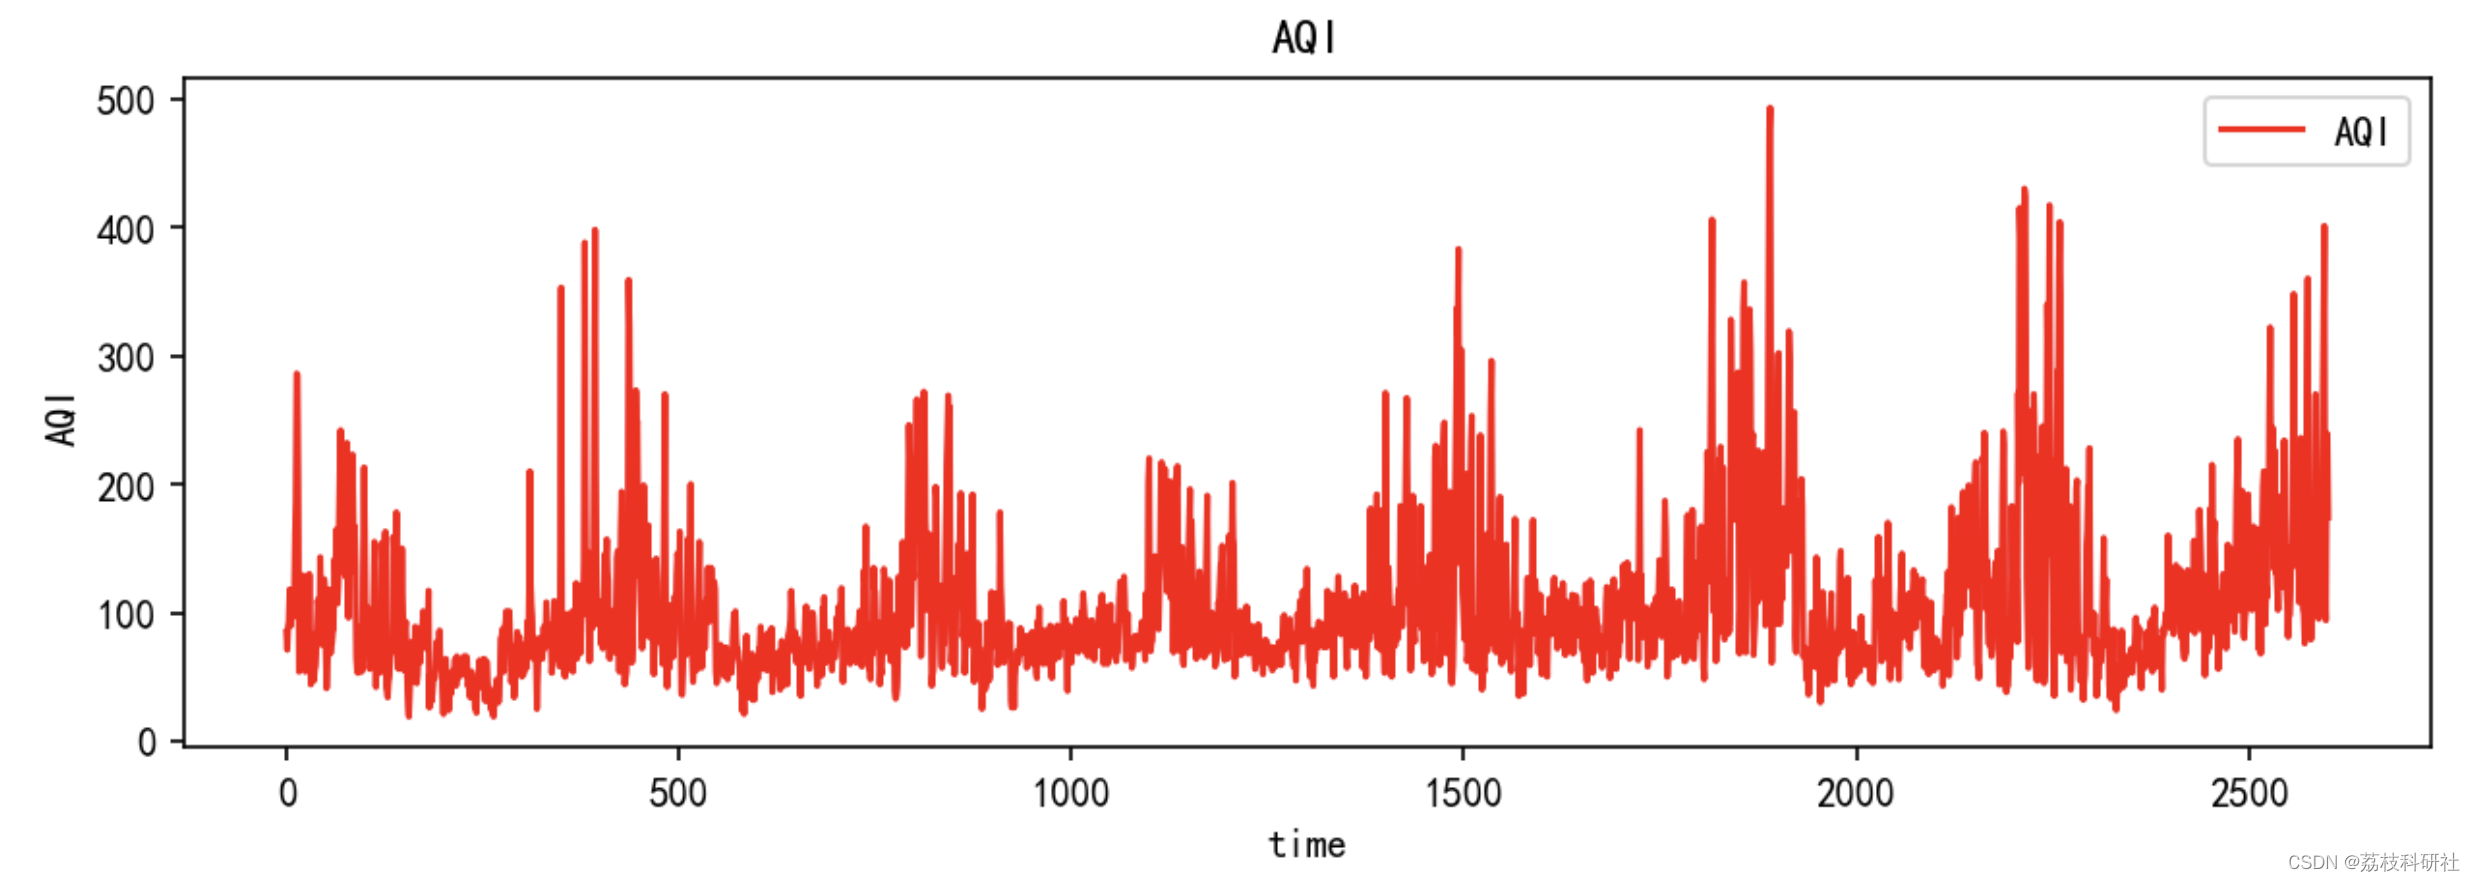
plt.figure(figsize=(10, 3),dpi=150)
plt.title('AQI')
plt.xlabel('time')
plt.ylabel('AQI')
plt.plot(data_raw, 'r', label='AQI')
plt.legend()
plt.show()

plt.figure(figsize=(9, 2),dpi=150)
plt.plot(history.history['loss'])
plt.title('model loss')
plt.ylabel('loss')
plt.xlabel('epoch')
plt.show()

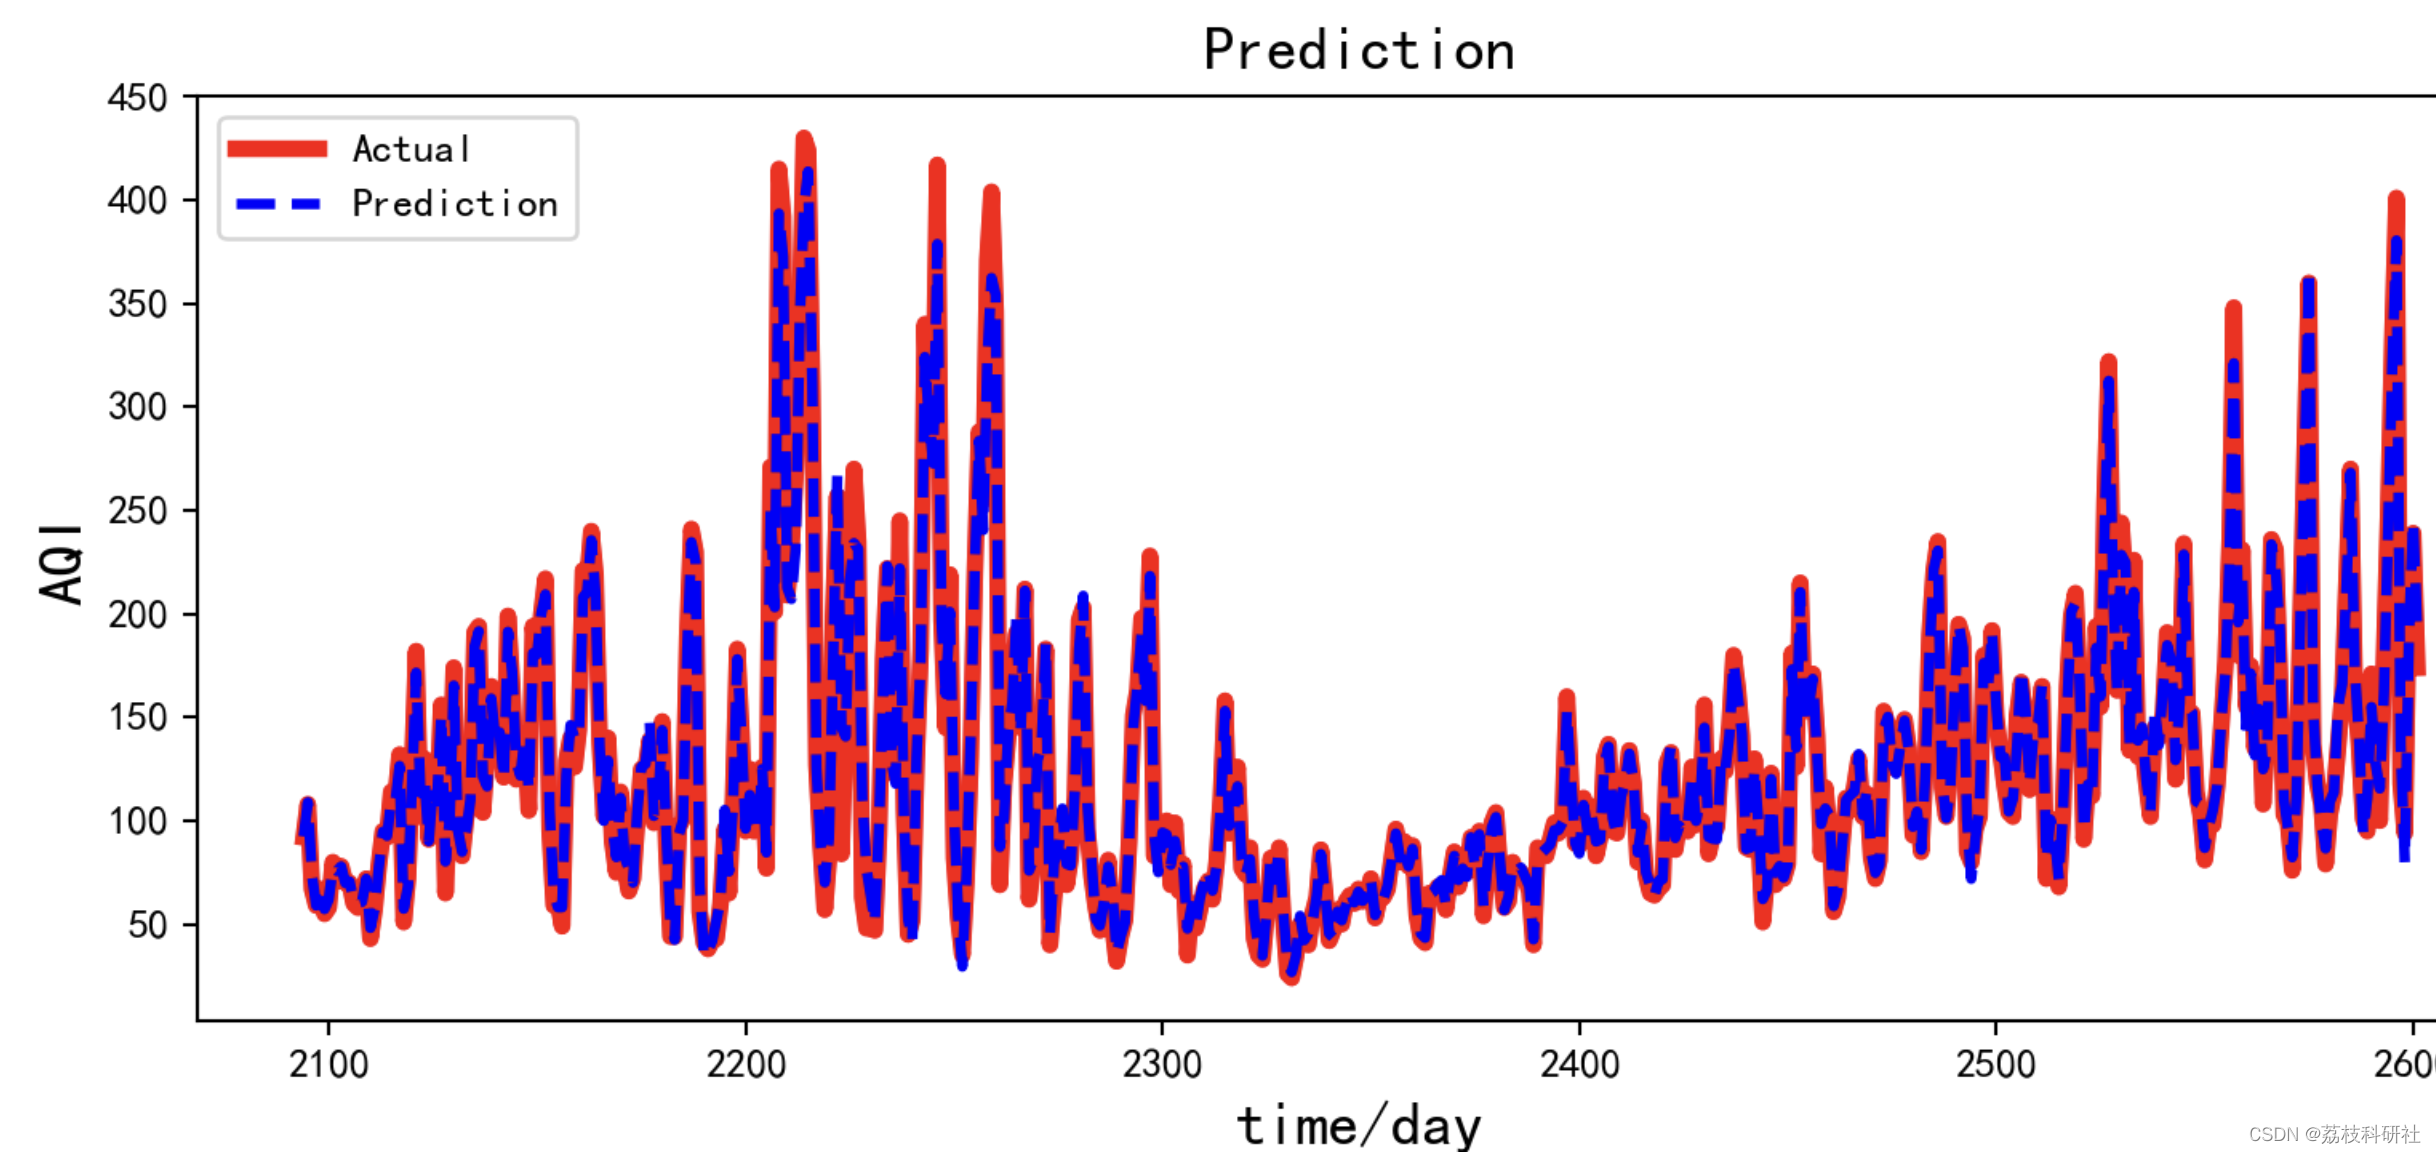
plt.figure(figsize=(10, 4),dpi=150)
plt.plot(test_data, label="Actual", color='red',linewidth=4)
plt.plot(range(len(x_train)+timestep+1,len(new_data)),draw_test, color='blue',label='Prediction',linewidth=2.5,linestyle="--")
plt.title('Prediction', size=15)
plt.ylabel('AQI',size=15)
plt.xlabel('time/day',size=15)
plt.legend()
plt.show()

🎉3 参考文献

部分理论来源于网络,如有侵权请联系删除。

[1]陈帅宇,赵龑骧,蒋磊.基于ARIMA-CNN-LSTM模型的黄河开封段水位预测研究[J].水利水电快报,2023,44(01):15-22.DOI:10.15974/j.cnki.slsdkb.2023.01.002.

🌈4 Python代码实现

  • 10
    点赞
  • 30
    收藏
    觉得还不错? 一键收藏
  • 0
    评论
Sure! Here's an example code for a CNN-LSTM prediction model using Keras with TensorFlow backend: ```python from keras.models import Sequential from keras.layers import Conv1D, LSTM, Dense, Flatten # Define the model model = Sequential() model.add(Conv1D(filters=32, kernel_size=3, activation='relu', input_shape=(timesteps, input_dim))) model.add(Conv1D(filters=64, kernel_size=3, activation='relu')) model.add(LSTM(128, return_sequences=True)) model.add(Flatten()) model.add(Dense(1, activation='sigmoid')) # Compile the model model.compile(optimizer='adam', loss='binary_crossentropy', metrics=['accuracy']) # Train the model model.fit(X_train, y_train, validation_data=(X_val, y_val), epochs=10, batch_size=64) # Make predictions predictions = model.predict(X_test) ``` In this code, we first import the necessary libraries. Then we define the model architecture using `Sequential` model from Keras. The model starts with a 1D convolutional layer (`Conv1D`) followed by a LSTM layer (`LSTM`). We then flatten the output of the LSTM layer and add a dense layer with sigmoid activation for binary classification. After defining the model architecture, we compile it by specifying the optimizer, loss function, and metrics. Next, we train the model using the `fit` function, providing the training data, validation data, number of epochs, and batch size. Finally, we can use the trained model to make predictions by calling the `predict` function on the test data. Please note that this is just a basic example and you may need to modify it based on your specific requirements and data.

“相关推荐”对你有帮助么?

  • 非常没帮助
  • 没帮助
  • 一般
  • 有帮助
  • 非常有帮助
提交
评论
添加红包

请填写红包祝福语或标题

红包个数最小为10个

红包金额最低5元

当前余额3.43前往充值 >
需支付:10.00
成就一亿技术人!
领取后你会自动成为博主和红包主的粉丝 规则
hope_wisdom
发出的红包
实付
使用余额支付
点击重新获取
扫码支付
钱包余额 0

抵扣说明:

1.余额是钱包充值的虚拟货币,按照1:1的比例进行支付金额的抵扣。
2.余额无法直接购买下载,可以购买VIP、付费专栏及课程。

余额充值