


02 Coordinate Systems
1.Geographic Coordinate System
A location reference system for spatial features on the Earth's surface. defined by longitude and latitude
-
Longitude & Latitude
-
Meridian & Parallel 子午线 & 纬线
-
meridian: lines of equal longitude; from north pole to south pole; actually arcs; show direction of true north and true south; converge at north pole and south pole
-
prime meridian: pass through Greenwich; 0; baseline for surveying longitude
-
Spheriod / Ellipsoid 球/椭球体
-
Geodetic coordinates 大地坐标系 (based on a spheriod)
2.Map Projections
-
The process of transforming the spatial relationship of features on the Earth's surface to a flat map 将地球表面空间特征关系转化为平面地图的过程
-
an mathematic transformation(functions, equations)
-
spherical Earth's surface to a plane
-
geographic coordinate systems to planar coordinate systems
-
always involves distortion!!!
-
Conic Projection 圆锥 : one type of map projection; use a cone as the projection surface
-
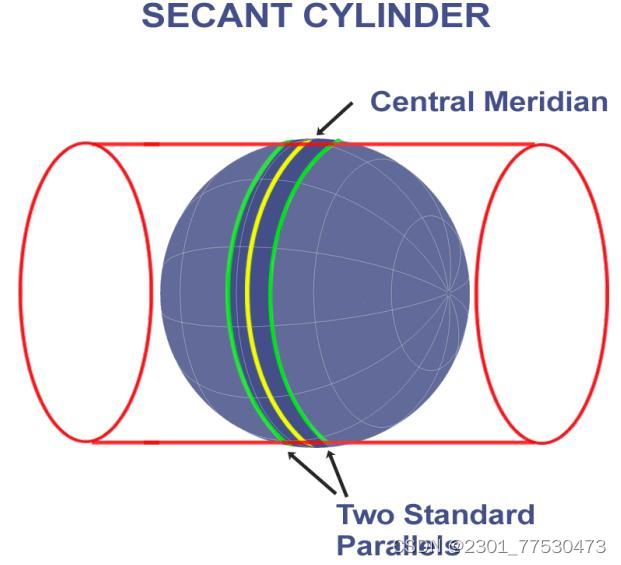
Cylindirical Projection 圆柱 : one type of map projection; use a cylinder as the projection surface
-
Azimuthal Projection 方位角 : retain certain accurate directions; use plane as~
-
Conformal Projection 等角
-
Equidistant Projection 等距
-
Equivalent Projection 等积
3.Commonly Used Map Projections
Lambert conformal conic projection
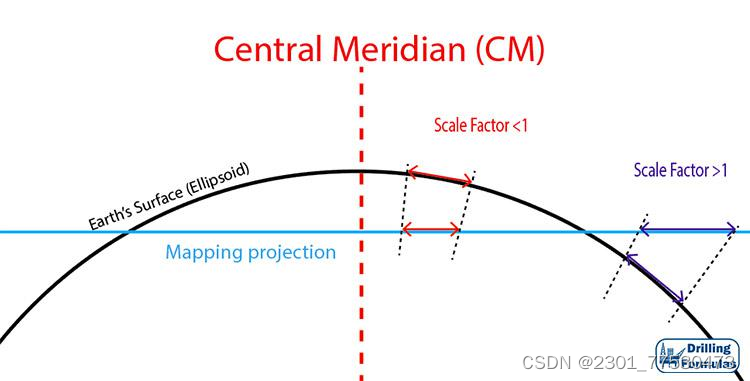
Transverse Mercator Projection
4.Projected Coordinate Systems 投影坐标系
-
A plane coordinate system that is based on a map projection 基于地图投影的平面坐标系
-
Reference global : reduced model of the Earth(a norminal / generating globe)
-
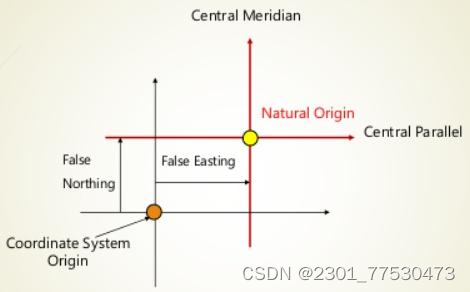
Central lines :
-
The central parallel and the central meridian. Together, they define the center or the origin of a map projection.
-
False easting / False northing: A value applied to the origin of a coordinate system to change the x/y coordinate readings
-
Standard line/ Standard meridian/ Standard parallel
-
Principal scale (same as the reference globe)& Scale factor(ration of the local scale to the scale of the reference globe)
-
Reprojection:重投影
Projection of spatial data from one projected coordinate system to another.
03 Vector Data Model
Spatial data
-
What: data having an implicit (e.g. address, ZIP code…) or explicit (e.g. x, y, z…) association with a location relative to the Earth
-
Two components:
-
Locations of spatial features : geometric data
-
Characterisitics of spatial features : attribute data
-
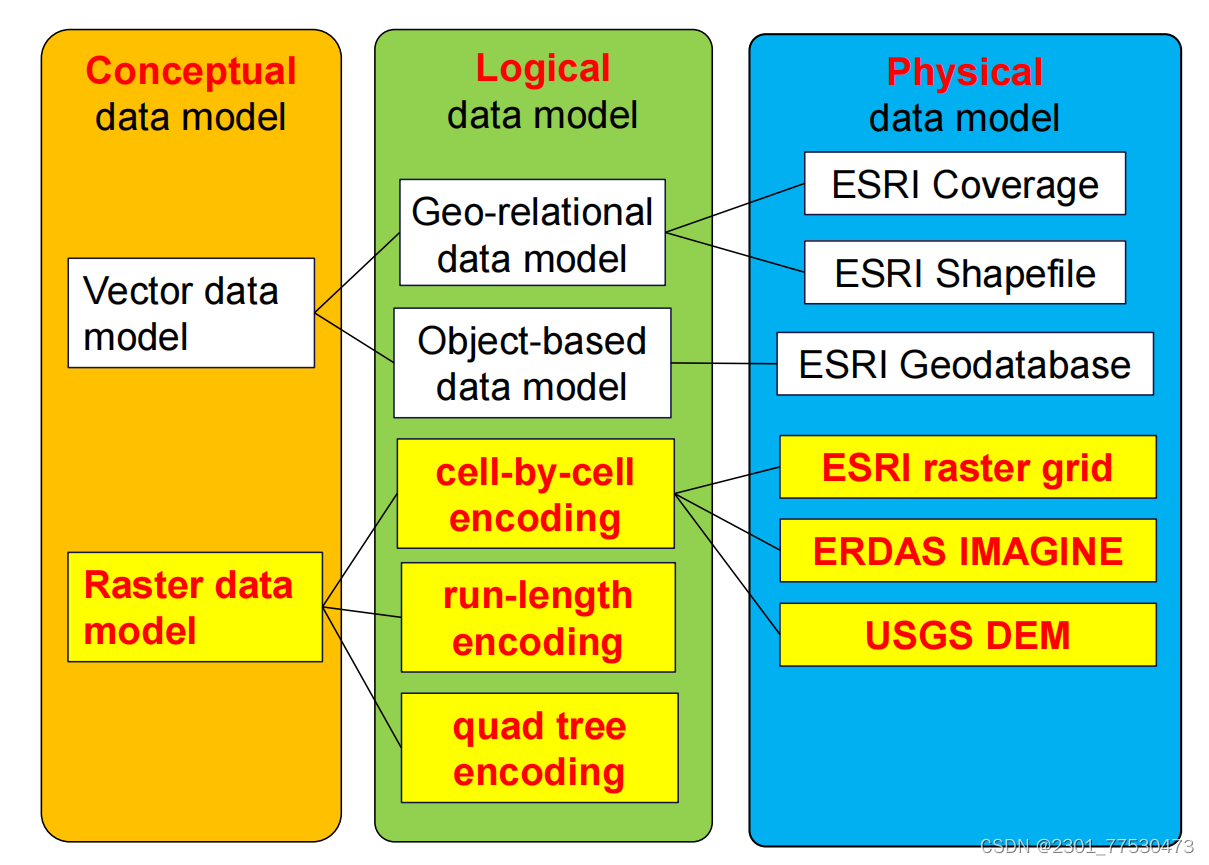
aspect of conceptual model: vector & raster
Vector data model
-
use geometric objects to represent simple spatial features
-
points line/polyline area/polygon
-
distinguished by 1.dimensionality 2. geometric property
-
connected methods: 1. smooth curves 2. straight-line segments
Topology
- properties of geometric objects // remain invariant // under transformations

Object-based data model
-
object-based: a single system
-
georelational: a split system
Triangulated Irregular Network
- Triangle: constant gradient
04 Raster Data Model
vector data model is ideal for discrete spatial features, not suitable for continuous spatial phenomena
Raster data model
-
Definition as conceptual model
-
use a regular grid to cover the space
-
small squares arranged in rows and columns
-
value in each grid cell corresponds to the characteristic of a spatial phenomenon at the cell location
-
the changes of the values from cell to cell reflect the spatial variation空间变化 of the phenomenon over the space
value → point-based(center of the cell 中心) || cell-based(entire cell)
Digital Elevation Models
pointed-based
06 Geometric Transformation
-
Definition:
-
the process of using a set of control points and transformation equations to register (digitized map, satellite image, air photography) onto projected coordinate systems
-
is a common operation in GIS , remote sensing, photogrammetry
-
But the mathematical aspects are from coordinate geometry
-
map-to-map transformation: from newly digitized map to projected coordinates
-
image-to-map transformation: from rows & columns to ~
-
root mean square (RMS) error
-
two categories of geometric transformation
-
linear
- equiarea(Euclidian); similarity; affine(仿射)(1st order polynomial); projective
-
non-linear
- high order polynomial(2nd/3rd order polynomial)
Affine 仿射
- combined: 1.roatation; 2.translation; 3.skew(shear); 4.differential scaling

-
preserve line parallelism
-
Control points
-
the points their coordinates in device coordinate system and map projection coordinate system are all available
-
6 unkown coefficients → more than 3 control points
-
Steps
-
Update control points to real-world coordinates
-
Run affine transformation to exam RMS error
-
Apply affine transformation to map features
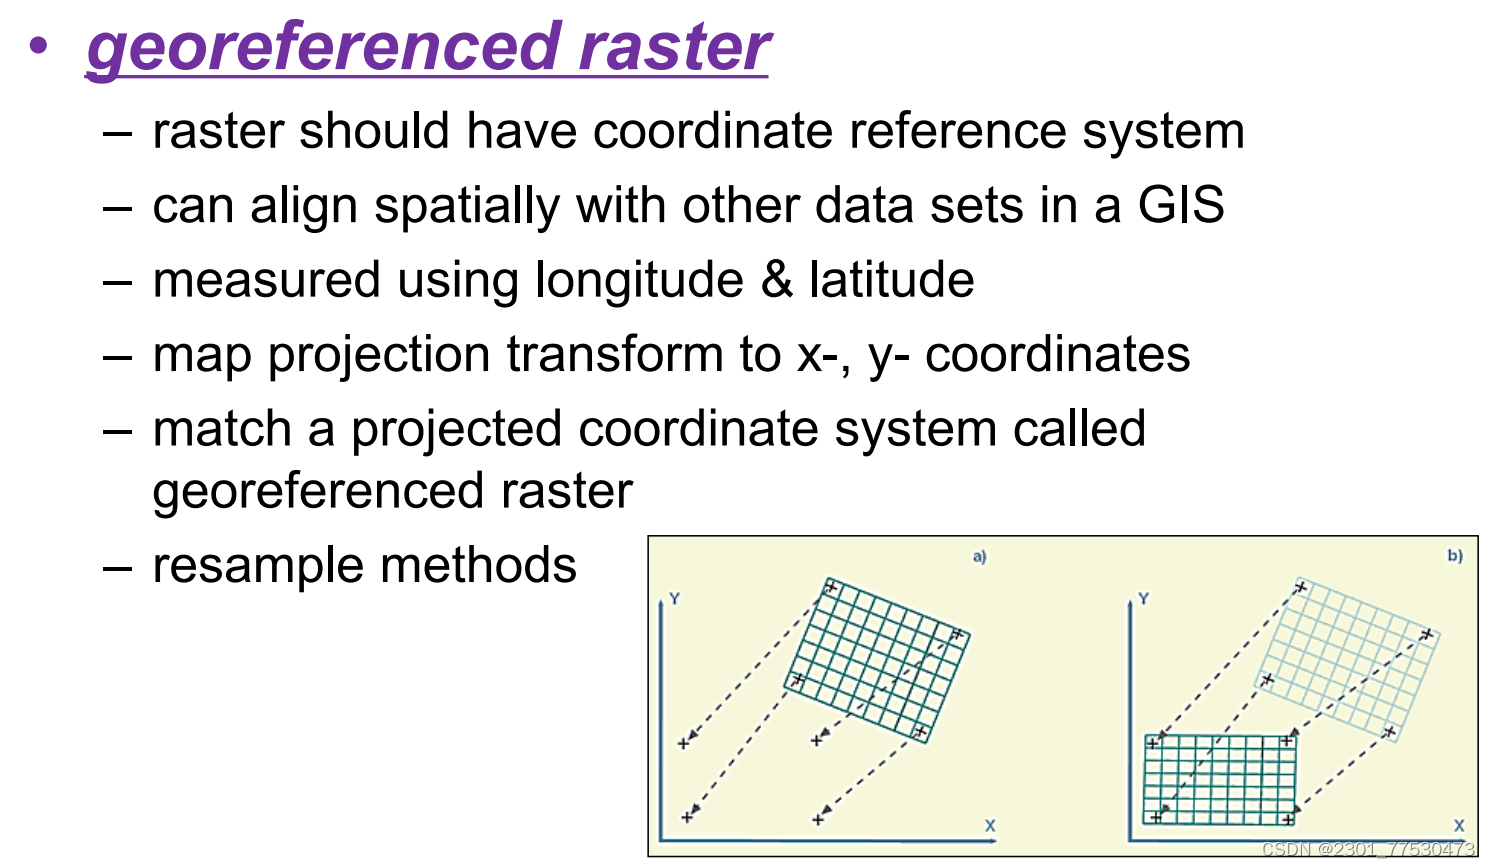
Resampling Methods
-
image to image transformation
-
result of geometric transformation of asatellite image is a new image based on a projected coordinate system
-
has no pixel value, pixel value must be filled through resampling
-
nearest neighbor
-
fills each pixel of the new image with the nearest pixel value from the original image
-
bilinear interpolation 双线性插值
-
uses the four nearest pixel values from three linear interpolations
-
cubic convolution 立方卷积
-
uses the average of the 16 nearest pixel values
-
from five cubic polynomial interpolations
07 Spatial Data Accuracy and Quality
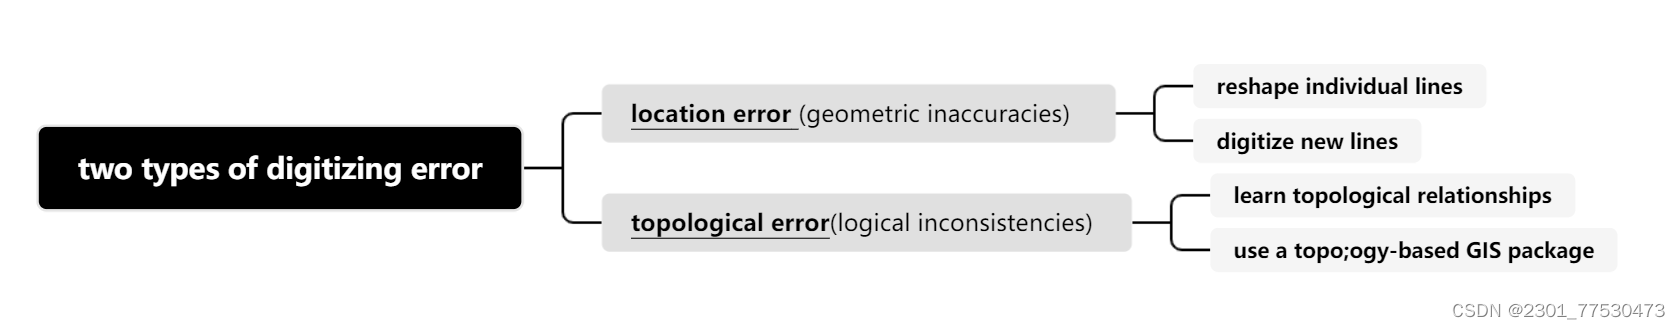
Location errors
-
geometric inaccuracy of digitized spatial data
-
examine errors by data source for digitizing
-
secondary data sources (paper maps)
-
primary data sources (GPS, remote sensing)
-
Causes:
-
human errors in manual digitizing
-
scaning and tracing
-
converting digitizied map into real-world coordinates
-
Data acc & Data precision 准确度与数据精度
-
Acc: how close the recorded location of spatial features to its ground location
-
Precision: how exactly the location is recorded
Topological errors
-
Violate topological relationships defined by software or users
-
spatial features of the same layer/between differnt spatial future layer
-
polygon: unclosed; gaps; overlapping
-
line: undershoot; overshoot
-
dangling node:
-
acceptable: dead-end streets; small tributaries
-
pseudo node(伪节点):
-
along continuous lines; divide a polyline unnecessarily into separate polylines
Editing
-
step:
-
create a new topology
-
validation of topology
-
fix errors & accept exceptions
08 Attribute Data Input and Management
-
three methods for linking tables
-
join
- one-to-one/ many-to one (inappropriate with one-many/many-many)
-
relate
-
relationship class
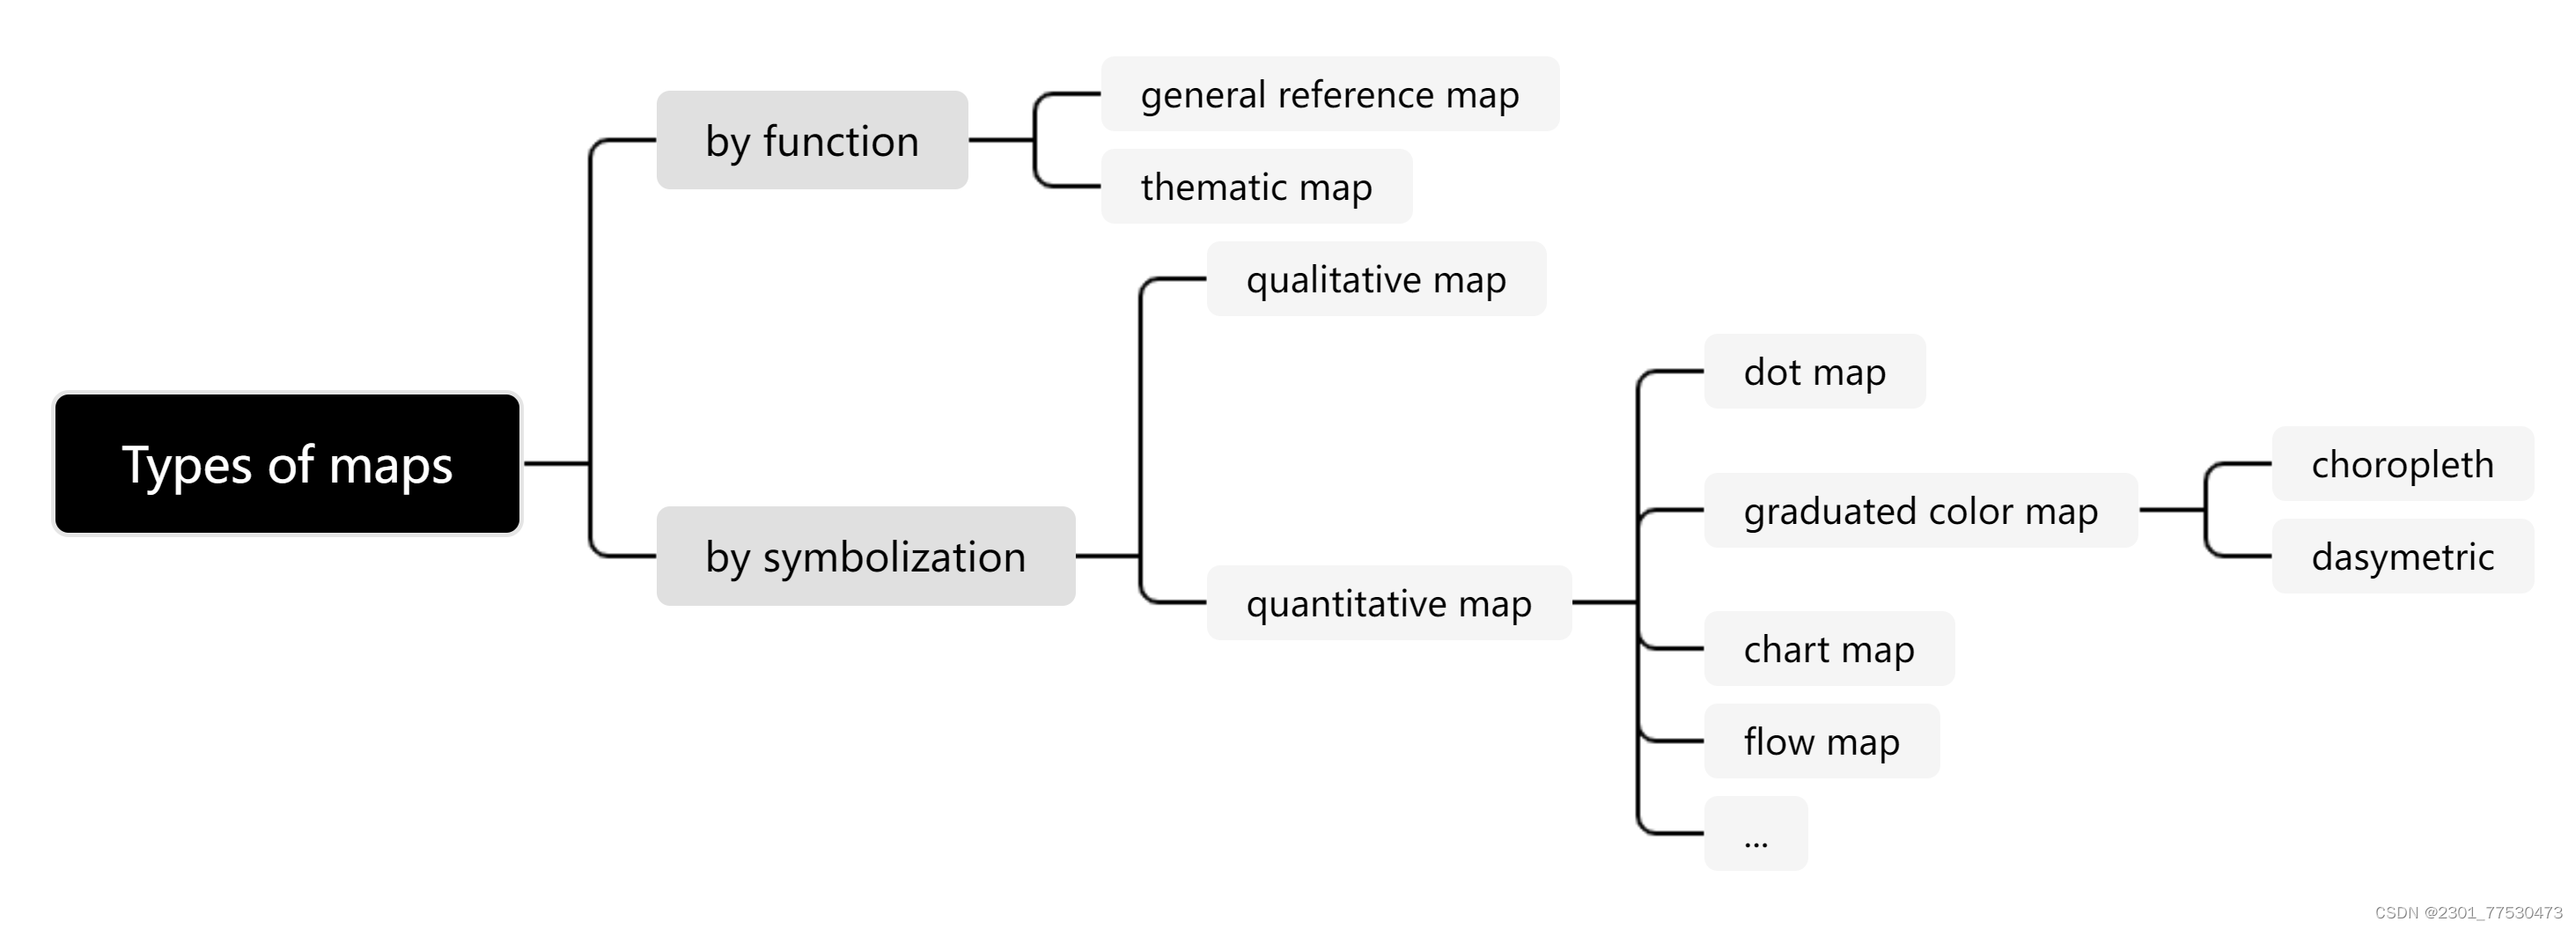
09 Data Display and Cartography
-
Definition:
-
Cartography is the study and practice of making maps.
-
Combining science, aesthetics, and technique, cartography builds on the premise that reality can be modeled in ways that communicate spatial information effectively
-
Elements: title; body; legend; north arrow; scale bar; acknowledgment; neatline/map border
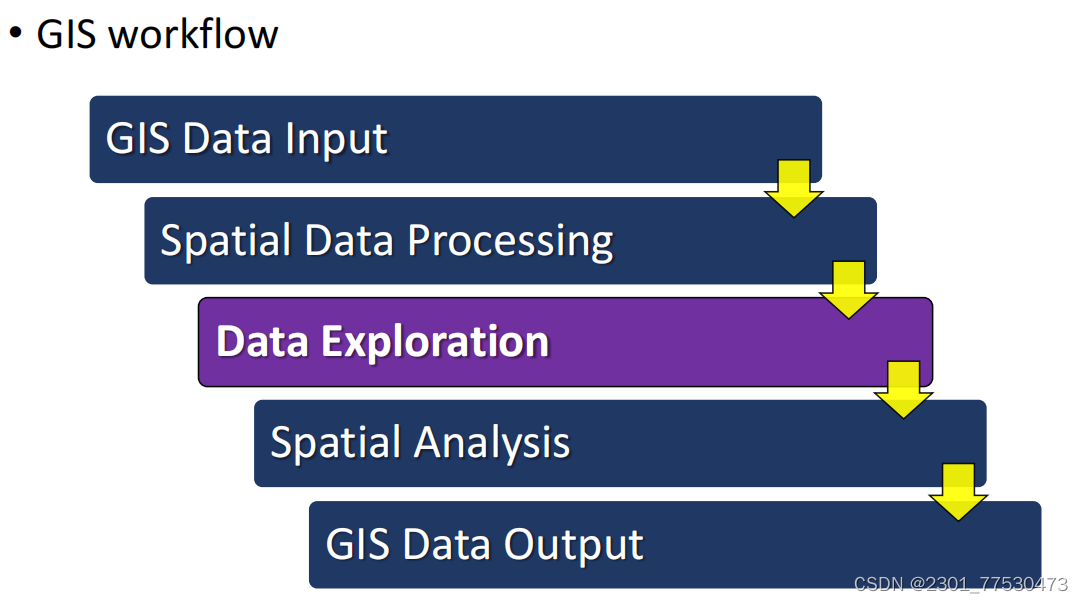
10 Data Exploration
-
3 components:
-
descrptive statistics; exploratory data analysis; dynamic graphs
11 Vector Data Analysis
spatial analysis → vector + raster
Buffering
buffering refers to the process of making a buffer zone with a specific distance around some spatial features
-
based on the concept of proximity
-
create two areas
-
within a specified distance from spatial features
-
beyond distance
-
one buffer zone || multiple buffer zones
-
side:
-
polyline: both/left/right
-
polygon: full/outside only
-
The boundaries of the buffer zones 1.remain intact,separate polygons 2. are dissolved, no overlapped area
-
end types: flat/round
-
distance measurement: Euclidian buffer/ geodestic buffer
Overlay
combines geometries and attributes of two or more feature layers to create the output
-
classification:
-
point-in-polygon
-
line-in-polygon
-
polygon-on-polygon
point、line、polygon input → polygon output
-
Methods
-
Union 并集
-
Intersect 交集
-
Symmetrical Difference 交集取反
-
Identity
Distance Measurement
Near tool || Point distance tool || Spatial Join
Pattern Analysis
Nearest neighbor
-
uses the distance between each point and its closest neighboring point in a layer
-
determine point pattern : random, regular, clustered
Moran's I
-
measure of spatial autocorrelation
-
spatial autocorrelation:
-
measures relationship among values of a variable according to spatial arrangement (distribution)
-
range from -1 → 1
-
Z-scores :
-
for statistical hypothesis testing, Moran's I values can be transformed to z-scores and corresponding confidence P values
-
indicates the likelihood that the point pattern could be a result of random chance
-
Local Indicators of Spatial Association (LISA)
G-Statistic
-
Getis-Orid Gi*
-
hot spot analysis
-
high positive Z-score → hot spot
-
low negative Z-score → cold spot
Feature Manipulation
-
Dissolve
-
aggregates features in a feature layer that have the same attribute value or values
-
Clip
-
creates a new layer that includes only those features of the input layer, including their attributes, that fall within the area extent of the clip layer
-
Append
-
creates a new layer by piecing together two or more layers, which represent the same feature and have the same attributes
-
Select
-
creates a new layer that contains features selected from a user-defined query expression
-
Eliminate
-
creates a new layer by removing features that meet a user-defined query expression
-
Update
-
uses a “cut and paste” operation to replace the input layer with the update layer and its feature
-
Erase
-
removes from the input layer those features that fall within the area extent of the erase layer
-
Split
-
divides the input layer into two or more layers.
12 Raster Data Analysis
based on Cell and Raster
-
2 types of cell value
-
numeric value
- continuous phenomena (DEM , temperature)
-
categorical value
- discrete phenomena (land use)
Local Operation
Reclassfication
-
one-to-one
-
range-to-one
Neighborhood Operationl 邻域运算
-
also called focal operation焦点操作 (need focal cell)
-
common operation
-
block operation
Zonal Operation
Zone → groups of cells of same values (contiguous 毗邻 and noncontiguous)
Physical Distance Measure Operations
-
global operation 全局
-
each cell value of output raster is potentially a function of all the cells of input raster
-
raster distance measure operation is a global operation
-
2 types
-
physical distance
-
cost distance
-
for each cell calculate straight-line (shortest) distances away from the nearest source cell of the raster
Slice
-
variation of reclassify
-
divide a continuous distance raster into equal-interval; equal-area; natural breaks distance zones
-
like buffer zones
Allocation and Direction
Outputs:
-
distance raster
-
allocation raster
-
direction raster
Other Operations
Data management
-
Clip: create a new raster by using a rectangle to extract a portion of the input raster
-
Mosaic : piece together multiple input rasters into a single raster
-
Extraction
13 Terrain Mapping and Analysis
Data types
raster-based DEM 数字高程
-
a regular array of elevation points
-
data sources
-
satellite images || radar data || LiDAR data
-
& DSM
-
DSM : digital surface model, includes the built and natural features on the Earth’s surface
-
DEM : bare-earth elevations, disregarding the extrusion of the built (e.g., buildings) or natural (e.g., vegetation cover) features
vector-based TIN 三角形不规则网络
- approximates the land surface with a series of nonoverlapping triangles
Terrain Mapping Methods
Contouring
-
contour line || contour interval || base contour
-
✔: close together; form closed lines
-
❌ : intersect one another; stop in the middle of a map
Vertical profiling 垂直分析
-
change in elevation along a line
-
straight or curved
Hill shading (shaded relief)
-
visual effect
-
the sun's azimuth 方位角
-
the sun's altitude 高度
-
surface's slope 坡度
-
surface's aspect 坡向
Hypsometric tinting
Perspective view
- 3D views of the terrain
Slope and Aspect Analysis
Slope
-
rate of change of elevation at a surface location
-
percent slope || degree slope
Aspect
- directional measure of slope
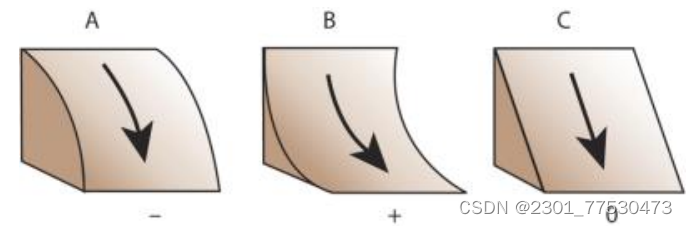
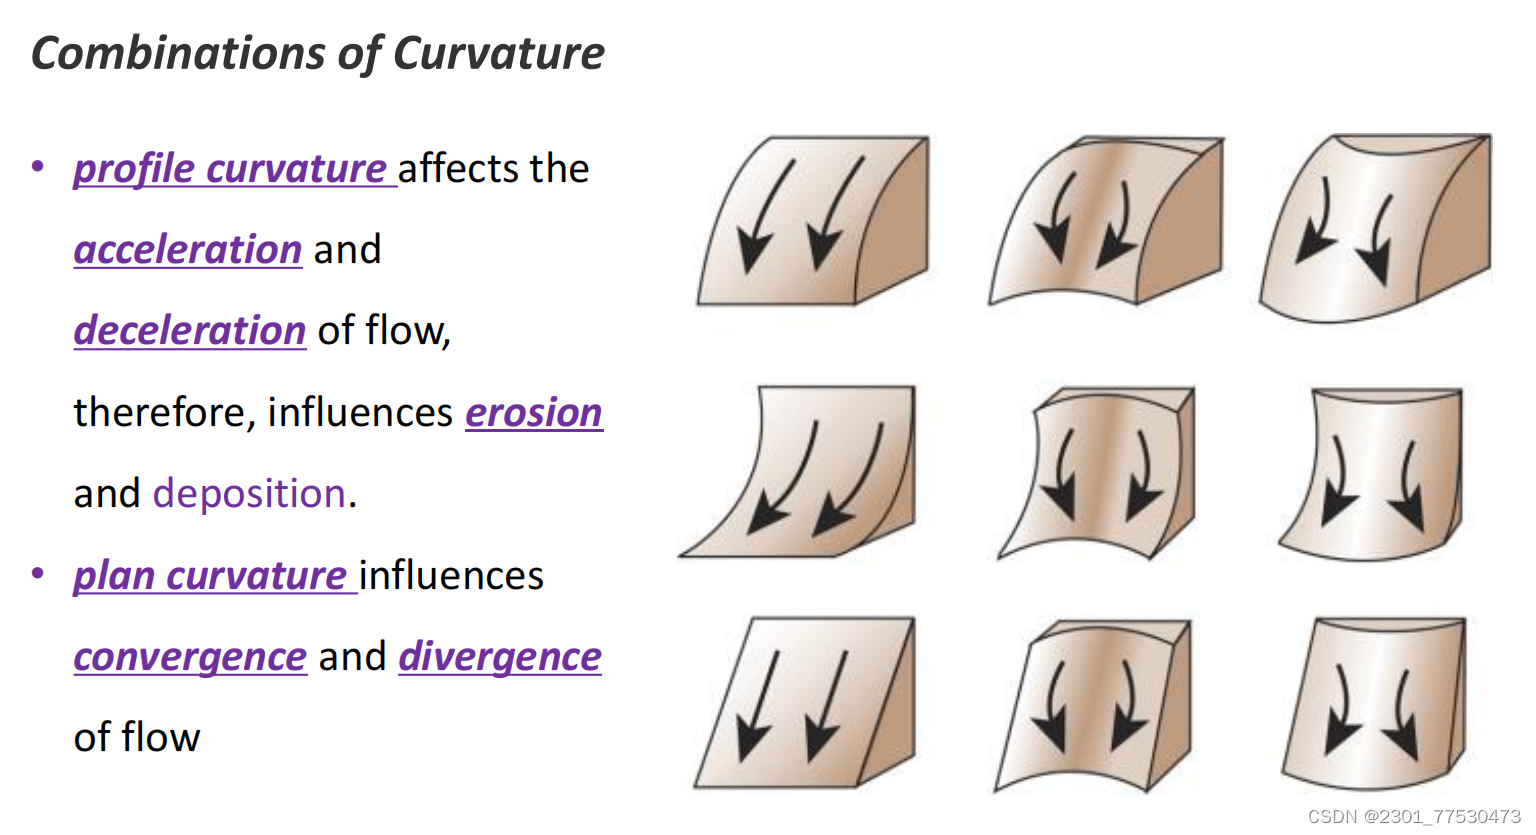
Deriving Surface Curvature from a DEM
Surface curvature 曲率
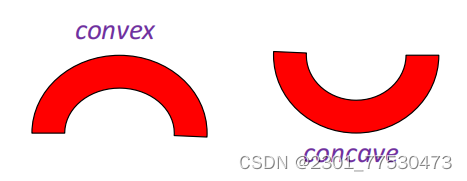
- profile curvature : parallel to the direction of the maximum slope
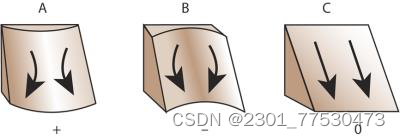
- plan curvature : perpendicular to the direction of the maximum slope
Plan curvature relates to the convergence and divergence of flow across a surface
14 Viewshed and Watershed Analysis
Viewshed Analysis
Viewshed
-
portion of land surface
-
visible from one or more viewpoints
analysis
-
process for deriving viewsheds
-
2 input data sets:
-
viewpoints (indicator where the observer is standing)
-
a vector point layer that contains one or more viewpoints
-
a vector line layer, the viewpoints are points (vertex) that make up the linear features
-
-
Terrain (DEM/TIN)
-
basic principle : line-of-sight operation
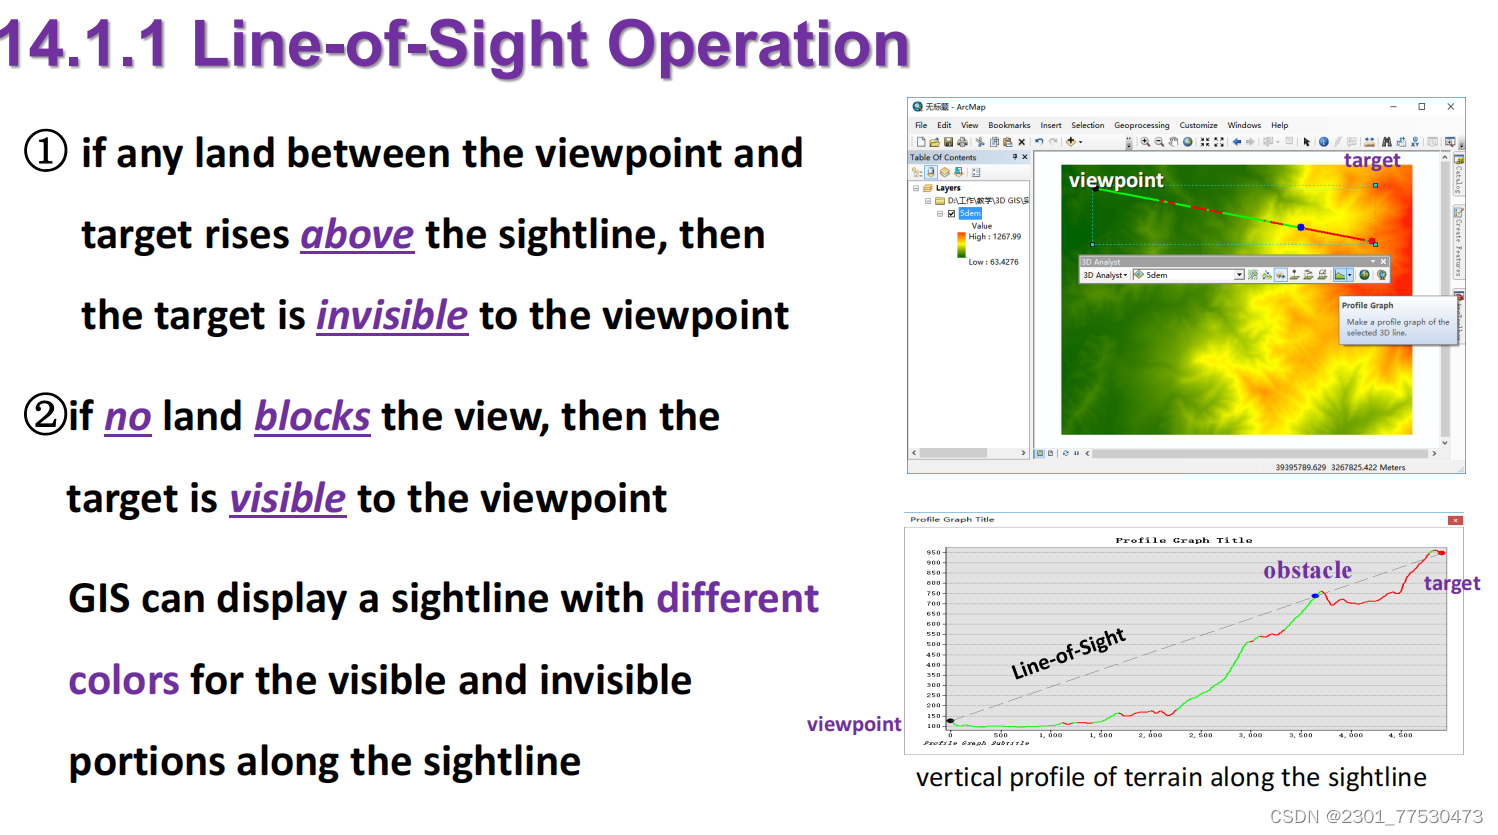
- steps of deriving a viewshed from DEM
-
set up a sightline between viewpoint and target
-
derive intermediate points along sightline at each cell
-
interpolate heights of intermediate points
-
examine height of intermediate points and determine if target is visible or not
-
output:
-
one viewpoint : binary raster (1→visible; 0→invisible)
-
two or more viewpoints : cumulative viewshed raster 累积可视光栅(0,1→n)
-
parameters:
-
viewpoint : fixed/to be selected
-
viewing azimuth 方位角
-
viewing radius 观察半径 :set the search distance for deriving visible area
-
vertical viewing angle limits 垂直视角限制
-
the Earth's curvature (ignored or corrected)
-
tree height (create forest elevation)
Watershed Analysis
Watershed
-
area defined by topographic divides
-
boundary of the watershed (mountain ridgeline)
-
that drains surface water to a common outlet
-
pour point (river mouth)
analysis
-
the process of :
-
using a raster DEM
-
perform raster data operation
-
to derive topographic features
-
to delineate watersheds
-
spatial scales: 1.large: stream system 2.small: tributary
-
watershed delineation 分水岭划分
-
area-based
-
divide a study area into a series of watersheds
-
one for each stream section
-
-
point-based
-
derive a watershed for each select point
-
point: outlet; gauge station(水文站); dam
-
- steps:
-
Filled DEM raster
-
elevation raster without depressions or sinks
-
depression 洼地
-
a cell/cells in an raster DEM which is surrounded by higher-evelation values, represents an area of internal drainage, must be removed
-
remove: increase the cell value to the lowest overflow point out of the sink 将其单元值(高度或高度)增加到汇聚外的最低溢出点(周围高度值最小的单元)
-
-
Flow Direction raster
-
shows the direction that water will flow out of each cell
-
algorithm : D8 method
-
-
Flow Accumulation raster
-
count for each cell of the raster the number of cells that will flow to it, or how many upstream cells will contribute drainage to each cell based on flow direction raster , the cell itself is not counted
-
be interpreted in two ways
-
geomorphology 地形学
-
cells having high flow accumulation values generally correspond to stream channels
-
zero - ridgelines
-
-
multiplied by the cell size, equals the drainage area 流域
-
-
Stream Network raster
-
derived from a flow accumulation
-
based on a threshold accumulation value
-
-
Stream Links raster
- each section of stream raster line is assigned a unique value and is associated with a flow direction, resembles a topology-based stream layer
-
Areawide Watersheds
-
delineate watershed for each stream section or stream link-based watersheds 划定每个河段的流域或者以河流为基础的流域
-
input: flow direction raster + stream link raster
-
-
Point-Based Watersheds
- delineate individual watersheds based on points of interest(pour points or outlets) 根据兴趣点划分单个流域
15 Spatial Interpolation 空间内插
Elements
- 2 basic inputs:
-
known points(control points)
-
an interpolation method
Type
-
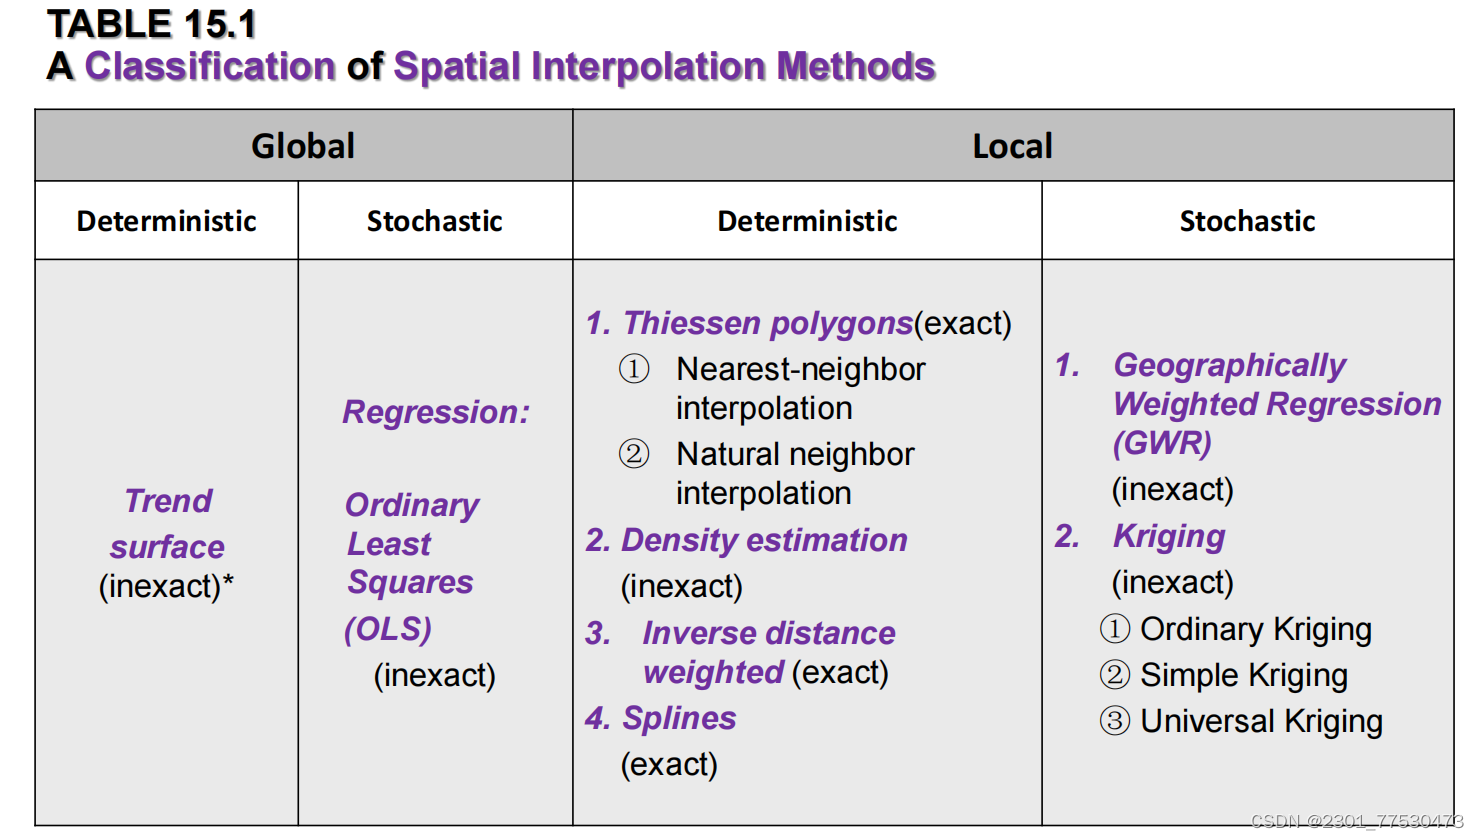
spatial interpolation categorized in 3 ways
-
global vs local
-
exact vs inexact
-
deterministic vs stochastic
Comparison of spatial interpolation methods
-
root mean square(RMS)
-
standardized RMS
16 Geocoding and Dynamic Segmentation
Geocoding
-
process of converting text-based postal address data into digital geographic coordinates, also called address geocoding, or address matching
-
2 sets of data:
-
street addresses table
-
reference database
-
process:
-
preprocessing
-
parsing : break down an address into components
-
address standardization
-
identifies and places each address component in order
-
standardizes variations of an address component to a consistent form
-
-
matching
-
plotting


 6763
6763


 被折叠的 条评论
为什么被折叠?
被折叠的 条评论
为什么被折叠?
 到【灌水乐园】发言


