


💥💥💞💞欢迎来到本博客❤️❤️💥💥
🏆博主优势:🌞🌞🌞博客内容尽量做到思维缜密,逻辑清晰,为了方便读者。
⛳️座右铭:行百里者,半于九十。
📋📋📋本文目录如下:🎁🎁🎁
目录
💥1 概述
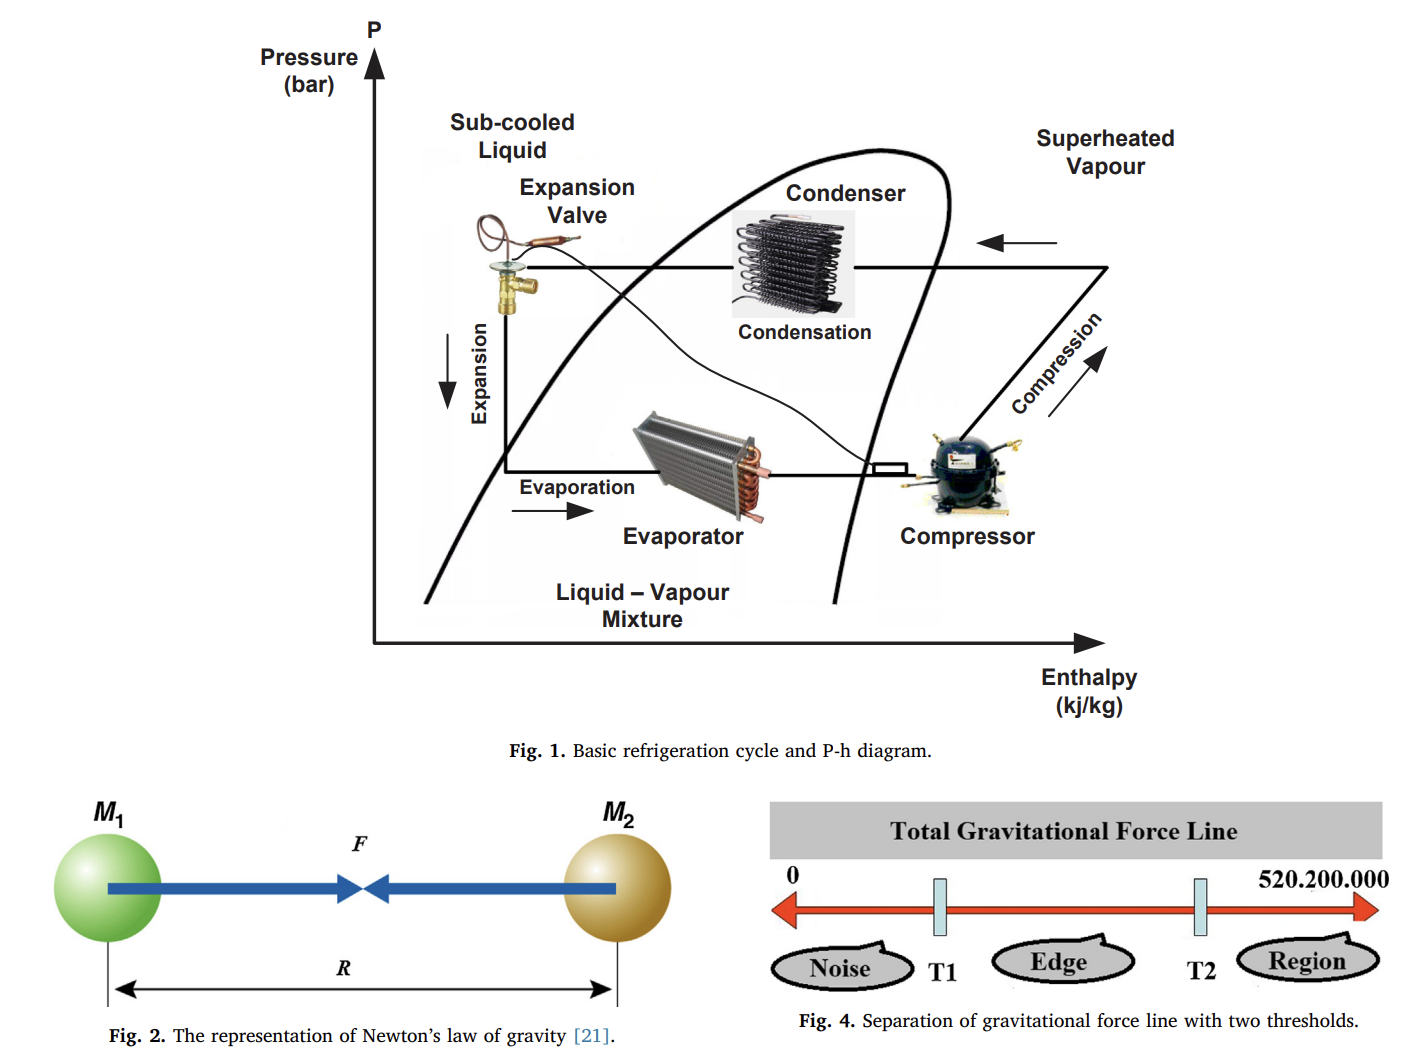
一种基于引力和侧向抑制网络的图像增强新算法.
红外热像仪产生的彩色红外图像中经常会遇到低对比度、噪点和边缘模糊等问题。针对这些问题,我们提出了一种基于引力和横向抑制网络的图像增强算法。
文献:

摘要:
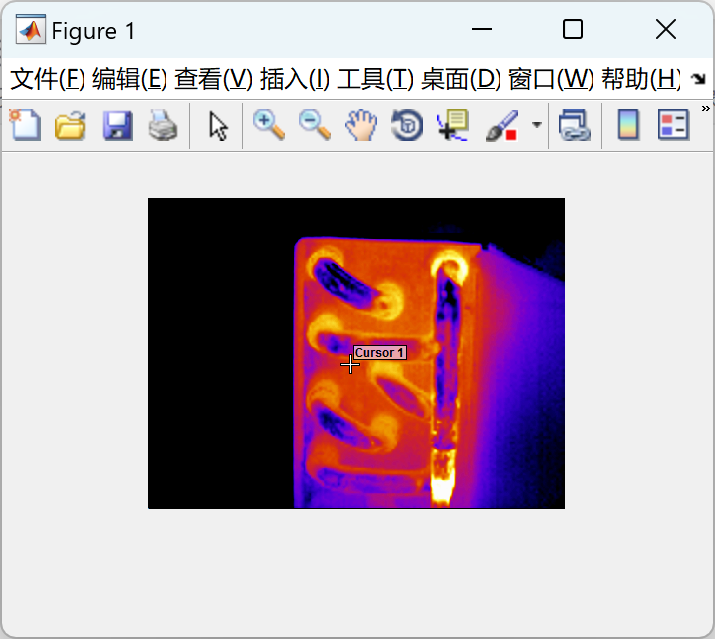
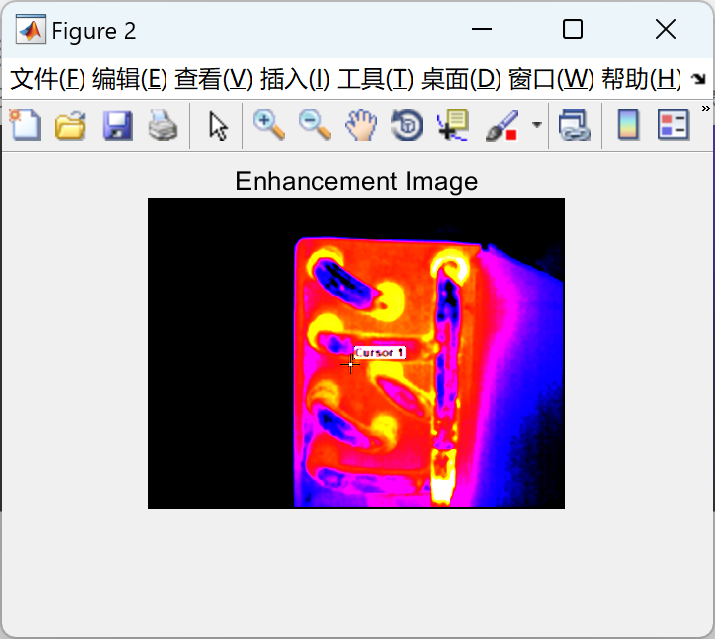
红外热像仪产生的彩色红外图像中经常会遇到低对比度、噪点和边缘模糊等问题。针对这些问题,我们提出了一种基于引力和横向抑制网络的图像增强算法。首先,获得彩色红外图像各维的总引力信息。这些使用三维颜色属性获得的二维三灰度图像有助于定义每个维度内的噪声、边缘和区域。其次,对这3张灰度图像进行双重阈值的约束。使用均值滤波器降低噪声,使用横向抑制网络进行分辨率和边缘检测,使用区域重力因子进行对比度控制。最后,再次组合每个维度并生成颜色增强图像。本研究旨在开发一种用于冷却系统中红外图像分析的增强图像的方法。研究中使用的图像由压缩机、冷凝器和属于冷却系统的蒸发器组成。我们的方法的实现简单易懂,并产生更准确的结果。实验结果表明,所提方法能够消除噪声、模糊和低对比度,并且比其他方法更能改善红外图像的细节。
关键词:
📚2 运行结果
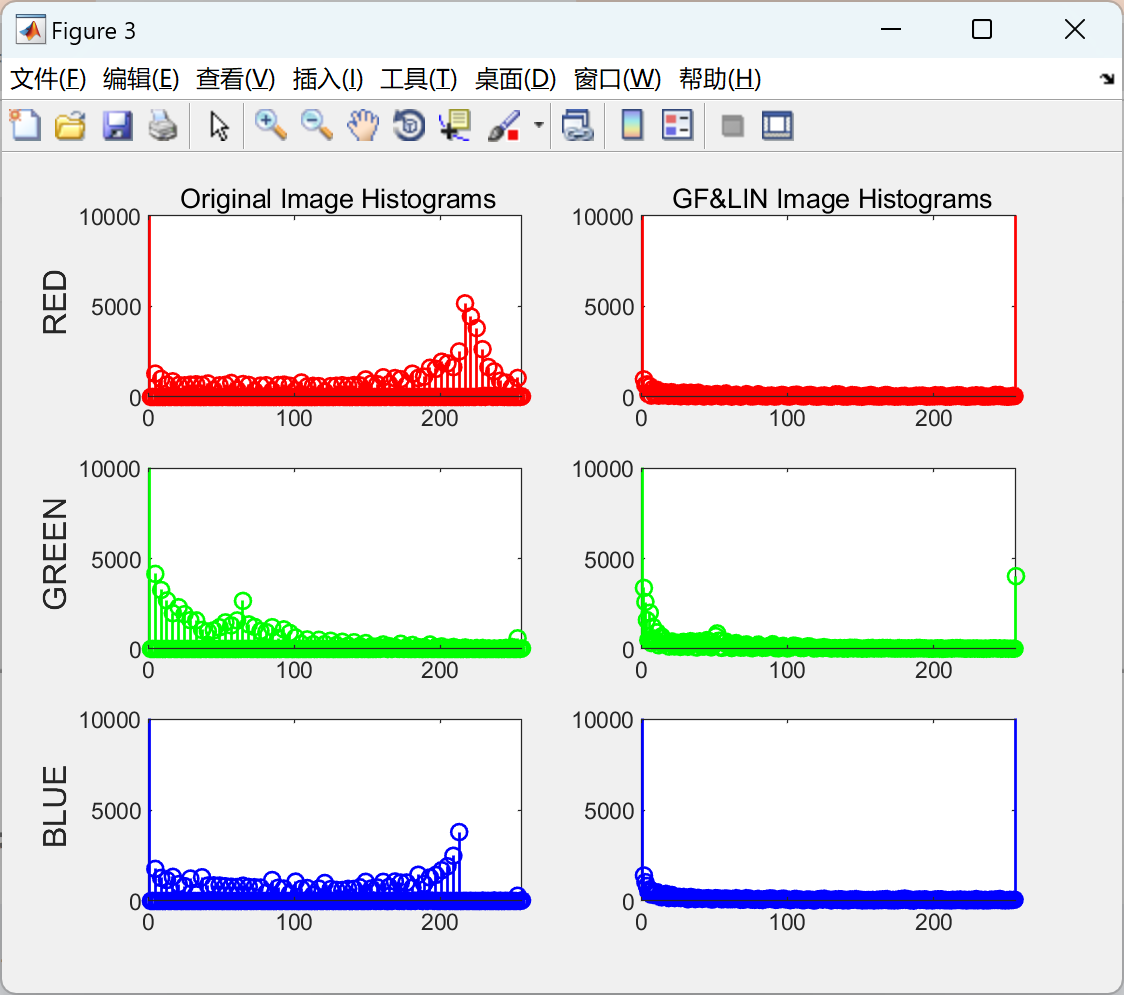
部分代码:
function varargout = rgbhist(I,Iout)
%RGBHIST   Histogram of RGB values.

if (size(I, 3) ~= 3)
    error('rgbhist:numberOfSamples', 'Input image must be RGB.')
end
if (size(Iout, 3) ~= 3)
    error('rgbhist:numberOfSamples', 'Input image must be RGB.')
end
nBins = 256;

rHist = imhist(I(:,:,1), nBins);
gHist = imhist(I(:,:,2), nBins);
bHist = imhist(I(:,:,3), nBins);

rHist_out = imhist(Iout(:,:,1), nBins);
gHist_out = imhist(Iout(:,:,2), nBins);
bHist_out = imhist(Iout(:,:,3), nBins);

%Input image curves
subplot(3,2,1);
h(1) = stem(1:256, rHist);
axis ([0 256 0 10000])
ylabel('\fontsize{12} RED');
title(['\fontsize{10} Original Image Histograms']);
subplot(3,2,3)
h(2) = stem(1:256, gHist);
axis ([0 256 0 10000])
ylabel('\fontsize{12} GREEN');
subplot(3,2,5)
h(3) = stem(1:256, bHist);
axis ([0 256 0 10000])
ylabel('\fontsize{12} BLUE');

set(h(1),'Color','r','LineWidth',1)

set(h(2),'Color','g','LineWidth',1)

set(h(3),'Color','b','LineWidth',1)

%Output image curves
subplot(3,2,2);
h(4) = stem(1:256, rHist_out);
axis ([0 256 0 10000])
title(['\fontsize{10} GF&LIN Image Histograms']);
subplot(3,2,4)
h(5) = stem(1:256, gHist_out);
axis ([0 256 0 10000])

subplot(3,2,6)
h(6) = stem(1:256, bHist_out);
axis ([0 256 0 10000])

set(h(4),'Color','r','LineWidth',1)

set(h(5),'Color','g','LineWidth',1)

set(h(6),'Color','b','LineWidth',1)
function varargout = rgbhist(I,Iout)
%RGBHIST Histogram of RGB values.
if (size(I, 3) ~= 3)
error('rgbhist:numberOfSamples', 'Input image must be RGB.')
end
if (size(Iout, 3) ~= 3)
error('rgbhist:numberOfSamples', 'Input image must be RGB.')
end
nBins = 256;
rHist = imhist(I(:,:,1), nBins);
gHist = imhist(I(:,:,2), nBins);
bHist = imhist(I(:,:,3), nBins);
rHist_out = imhist(Iout(:,:,1), nBins);
gHist_out = imhist(Iout(:,:,2), nBins);
bHist_out = imhist(Iout(:,:,3), nBins);
%Input image curves
subplot(3,2,1);
h(1) = stem(1:256, rHist);
axis ([0 256 0 10000])
ylabel('\fontsize{12} RED');
title(['\fontsize{10} Original Image Histograms']);
subplot(3,2,3)
h(2) = stem(1:256, gHist);
axis ([0 256 0 10000])
ylabel('\fontsize{12} GREEN');
subplot(3,2,5)
h(3) = stem(1:256, bHist);
axis ([0 256 0 10000])
ylabel('\fontsize{12} BLUE');
set(h(1),'Color','r','LineWidth',1)
set(h(2),'Color','g','LineWidth',1)
set(h(3),'Color','b','LineWidth',1)
%Output image curves
subplot(3,2,2);
h(4) = stem(1:256, rHist_out);
axis ([0 256 0 10000])
title(['\fontsize{10} GF&LIN Image Histograms']);
subplot(3,2,4)
h(5) = stem(1:256, gHist_out);
axis ([0 256 0 10000])
subplot(3,2,6)
h(6) = stem(1:256, bHist_out);
axis ([0 256 0 10000])
set(h(4),'Color','r','LineWidth',1)
set(h(5),'Color','g','LineWidth',1)
set(h(6),'Color','b','LineWidth',1)
🎉3 参考文献
文章中一些内容引自网络,会注明出处或引用为参考文献,难免有未尽之处,如有不妥,请随时联系删除。


 145
145

 被折叠的 条评论
为什么被折叠?
被折叠的 条评论
为什么被折叠?
 到【灌水乐园】发言


