<template>
<div id="main"></div>
</template>
<script setup>
import { onMounted } from "vue";
import * as echarts from "echarts";
let data={
x:[
-3,-2.6842105263157894,-2.3684210526315788,
-2.052631578947368,-1.7368421052631575,-1.421052631578947,-1.1052631578947363,
-0.7894736842105258,-0.47368421052631526,-0.15789473684210475,
0.15789473684210575,0.47368421052631626,0.7894736842105268,
1.1052631578947372,1.4210526315789478,1.7368421052631584,
2.052631578947369, 2.3684210526315796,2.6842105263157903],
y:[
0.0044318484119380075, 0.010873446008403894, 0.02414573124668899,
0.04852933916733306, 0.08827937454560608, 0.14534663197630093,
0.21659157163219764, 0.292125176410827, 0.3566048764304543,
0.394000182232257, 0.39400018223225697, 0.3566048764304541,
0.29212517641082686, 0.21659157163219742, 0.14534663197630074,
0.08827937454560594, 0.04852933916733297, 0.024145731246688947,
0.010873446008403865],
nominal:0,
lower:-1.0,
upper:1.0
};
let arr= [];
for(let i=0;i<data.x.length;i++){
arr.push([data.x[i],data.y[i]])
}
console.log('arr',arr);
onMounted(() => {
// 1.基于准备好的dom,初始化echarts实例
var myChart = echarts.init(document.getElementById("main"));
// 2.指定图表的配置项和数据, Echarts 图的配置
var option = {
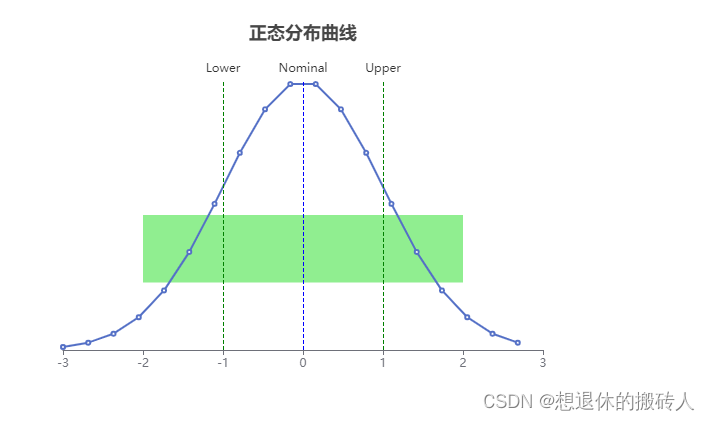
title: {
text: '正态分布曲线',
left: 'center'
},
xAxis: {
type: 'value',
splitLine:{
show:false
}
},
yAxis: {
type: 'value',
axisLine: {
show: false
},
axisLabel: {
show: false
},
splitLine: {
show: false
},
axisTick:{
show: false
}
},
series: [{
type: 'line',
data: arr,
markLine: {
symbol: ['none', 'none'],
data: [
{ xAxis: data.nominal, name: 'Nominal', label: { formatter: 'Nominal' },
lineStyle:{
color:'blue'
} },
{ xAxis: data.lower, name: 'Lower', label: { formatter: 'Lower' } , lineStyle:{
color:'green'
}},
{ xAxis: data.upper, name: 'Upper', label: { formatter: 'Upper' } ,
lineStyle:{
color:'green'
}}
]
},
markArea: {
itemStyle: {
color: 'lightGreen'
},
data: [
[{
xAxis: -2,
yAxis: 0.1
}, {
xAxis: 2,
yAxis: 0.2
}]
]
},
}]
}
// 3.使用刚指定的配置项和数据显示图表。
myChart.setOption(option);
window.addEventListener("resize", () => {
myChart.resize()
})
});
</script>
<style>
#main {
width: 600px;
height: 400px;
}
</style>


 7883
7883


 被折叠的 条评论
为什么被折叠?
被折叠的 条评论
为什么被折叠?
 到【灌水乐园】发言


