


wget --no-check-certificate https://raw.github.com/oldratlee/useful-scripts/release-2.x/bin/show-busy-java-threads> chmod +x show-busy-java-threads> ./show-busy-java-threads

show-busy-java-threads# 从所有运行的Java进程中找出最消耗CPU的线程(缺省5个),打印出其线程栈# 缺省会自动从所有的Java进程中找出最消耗CPU的线程,这样用更方便# 当然你可以手动指定要分析的Java进程Id,以保证只会显示你关心的那个Java进程的信息show-busy-java-threads -p <指定的Java进程Id> show-busy-java-threads -c <要显示的线程栈数>
方法 c: arthas thread
===================
阿里开源的arthas现在已经几乎包揽了我们线上排查问题的工作,提供了一个很完整的工具集。在这个场景中,也只需要一个thread -n 命令即可。
curl -O https://arthas.gitee.io/arthas-boot.jar # 下载
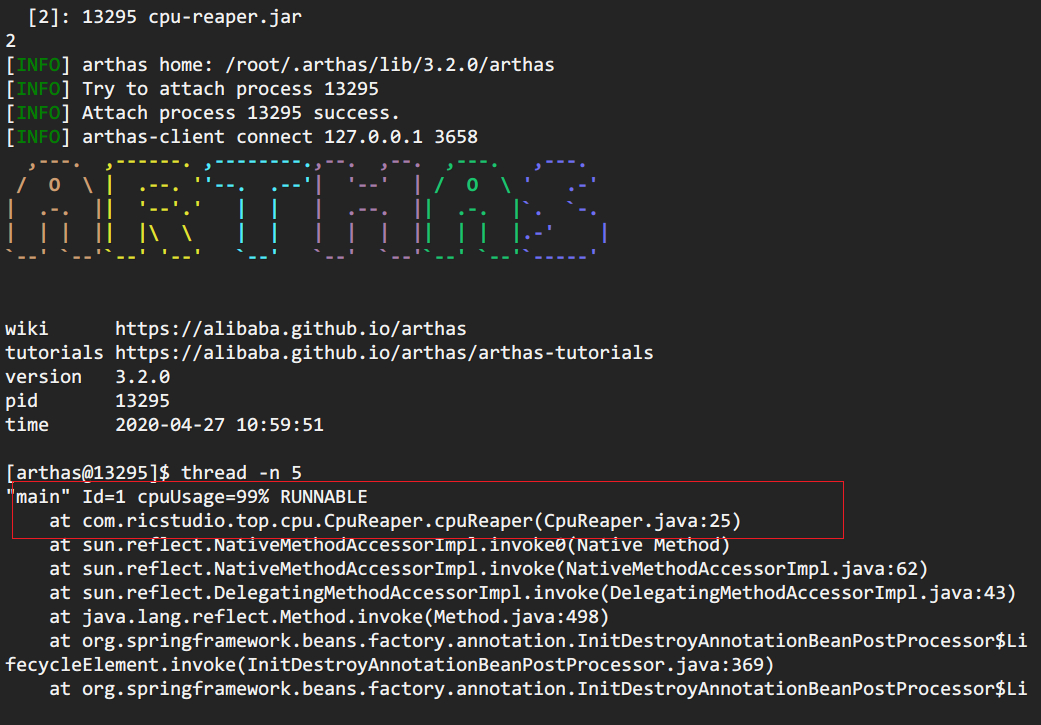
要注意的是,arthas的cpu占比,和前面两种cpu占比统计方式不同。前面两种针对的是Java进程启动开始到现在的cpu占比情况,arthas这种是一段采样间隔内,当前JVM里各个线程所占用的cpu时间占总cpu时间的百分比。
具体见官网:
https://alibaba.github.io/arthas/thread.html
后续
==
通过第一步,找出有问题的代码之后,观察到线程栈之后。我们就要根据具体问题来具体分析。这里举几个例子。
情况一:发现使用CPU最高的都是GC 线程。
======================
GC task thread#0 (ParallelGC)" os_prio=0 tid=0x00007fd99001f800 nid=0x779 runnableGC task thread#1 (ParallelGC)" os_prio=0 tid=0x00007fd990021800 nid=0x77a runnable GC task thread#2 (ParallelGC)" os_prio=0 tid=0x00007fd990023000 nid=0x77b runnable GC task thread#3 (ParallelG
 最低0.47元/天 解锁文章


 942
942


 被折叠的 条评论
为什么被折叠?
被折叠的 条评论
为什么被折叠?
 到【灌水乐园】发言


