


Grafana是基于普罗米修斯作为数据源,的可视化的监控组件,可以对springboot应用就行全方位的监控
总体思路:springboot应用通过 actuator 对外暴露普罗米修斯支持的 监控节点数据 --> 被普罗米修斯定时抓取抓取 --> 被Grafana定时抽取
一、 构建spring boot工程
1.1、添加下面的依赖,也可根据需求扩展
通过actuator对外暴露运行指标数据,
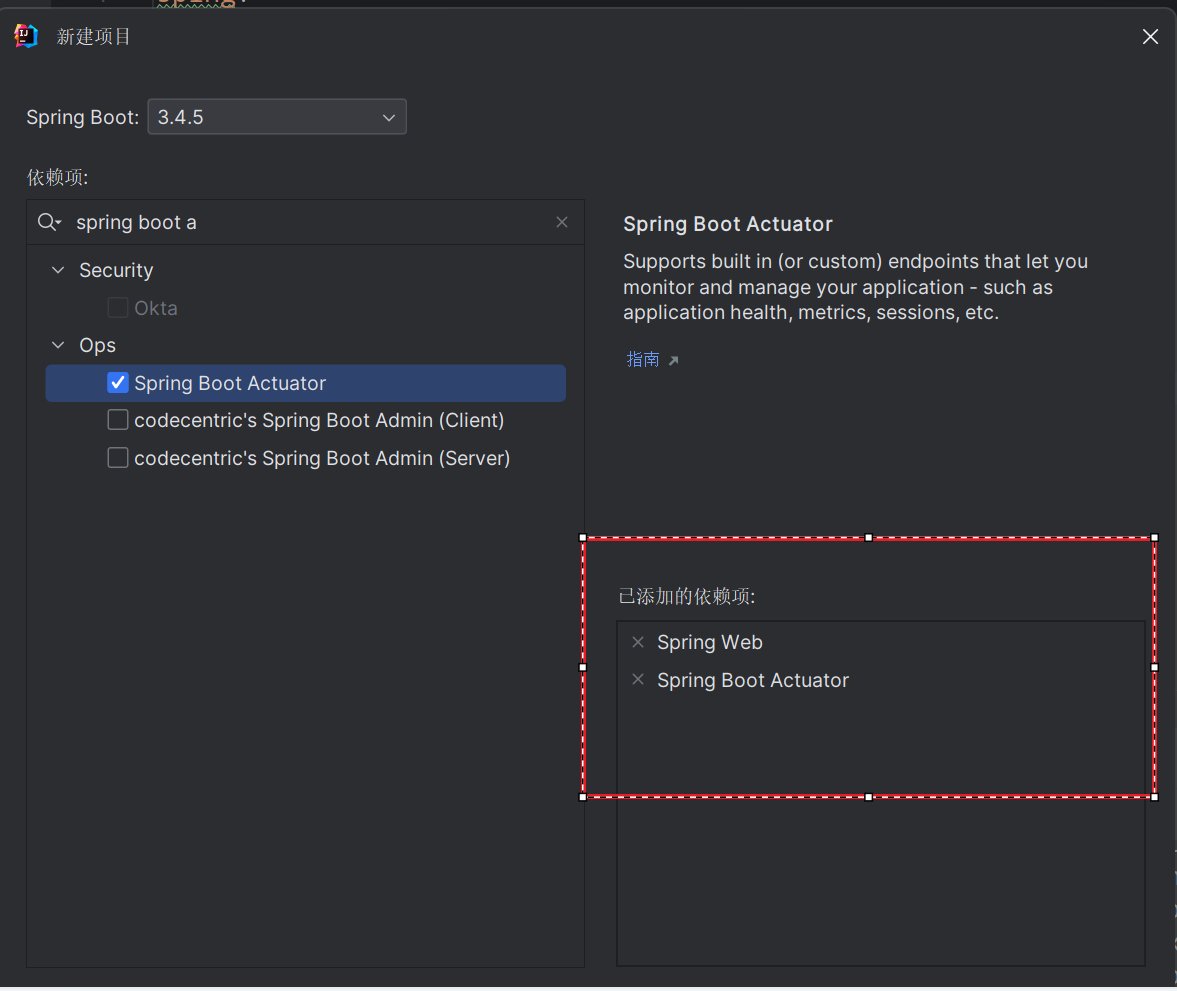
1.2、确保pom文件中有对应依赖
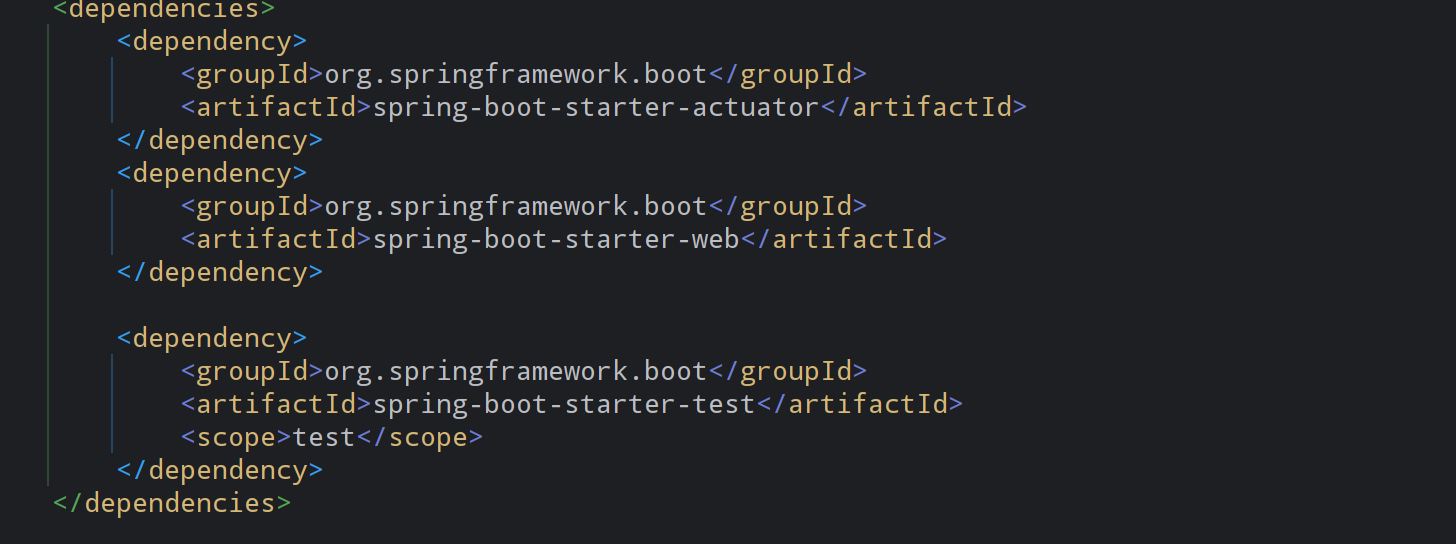
    <dependencies>
        <dependency>
            <groupId>org.springframework.boot</groupId>
            <artifactId>spring-boot-starter-actuator</artifactId>
        </dependency>
        <dependency>
            <groupId>org.springframework.boot</groupId>
            <artifactId>spring-boot-starter-web</artifactId>
        </dependency>

        <dependency>
            <groupId>org.springframework.boot</groupId>
            <artifactId>spring-boot-starter-test</artifactId>
            <scope>test</scope>
        </dependency>
    </dependencies>
1.3、编辑配置文件
将文件改成yml格式
添加以下内容
一 :工程名字
二:对外暴露的监控指标,这是选择全部
三:端口
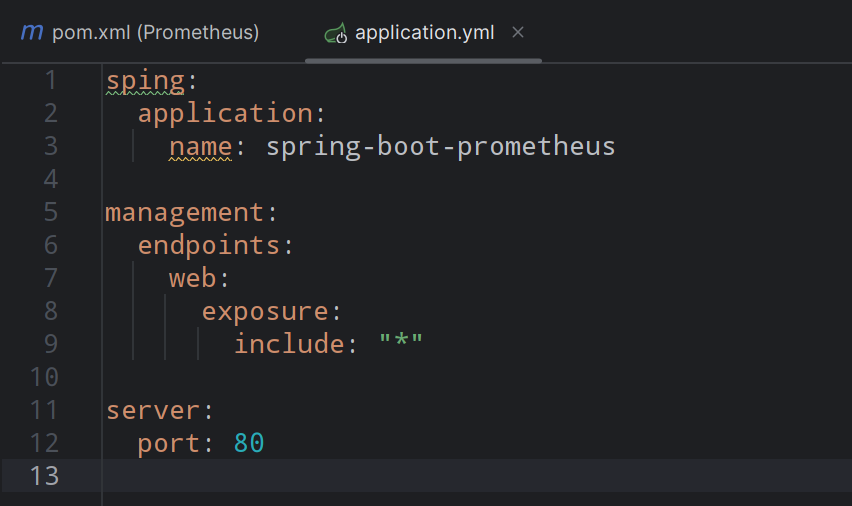
sping:
  application:
    name: spring-boot-prometheus

management:
  endpoints:
    web:
      exposure:
        include: "*"

server:
  port: 80
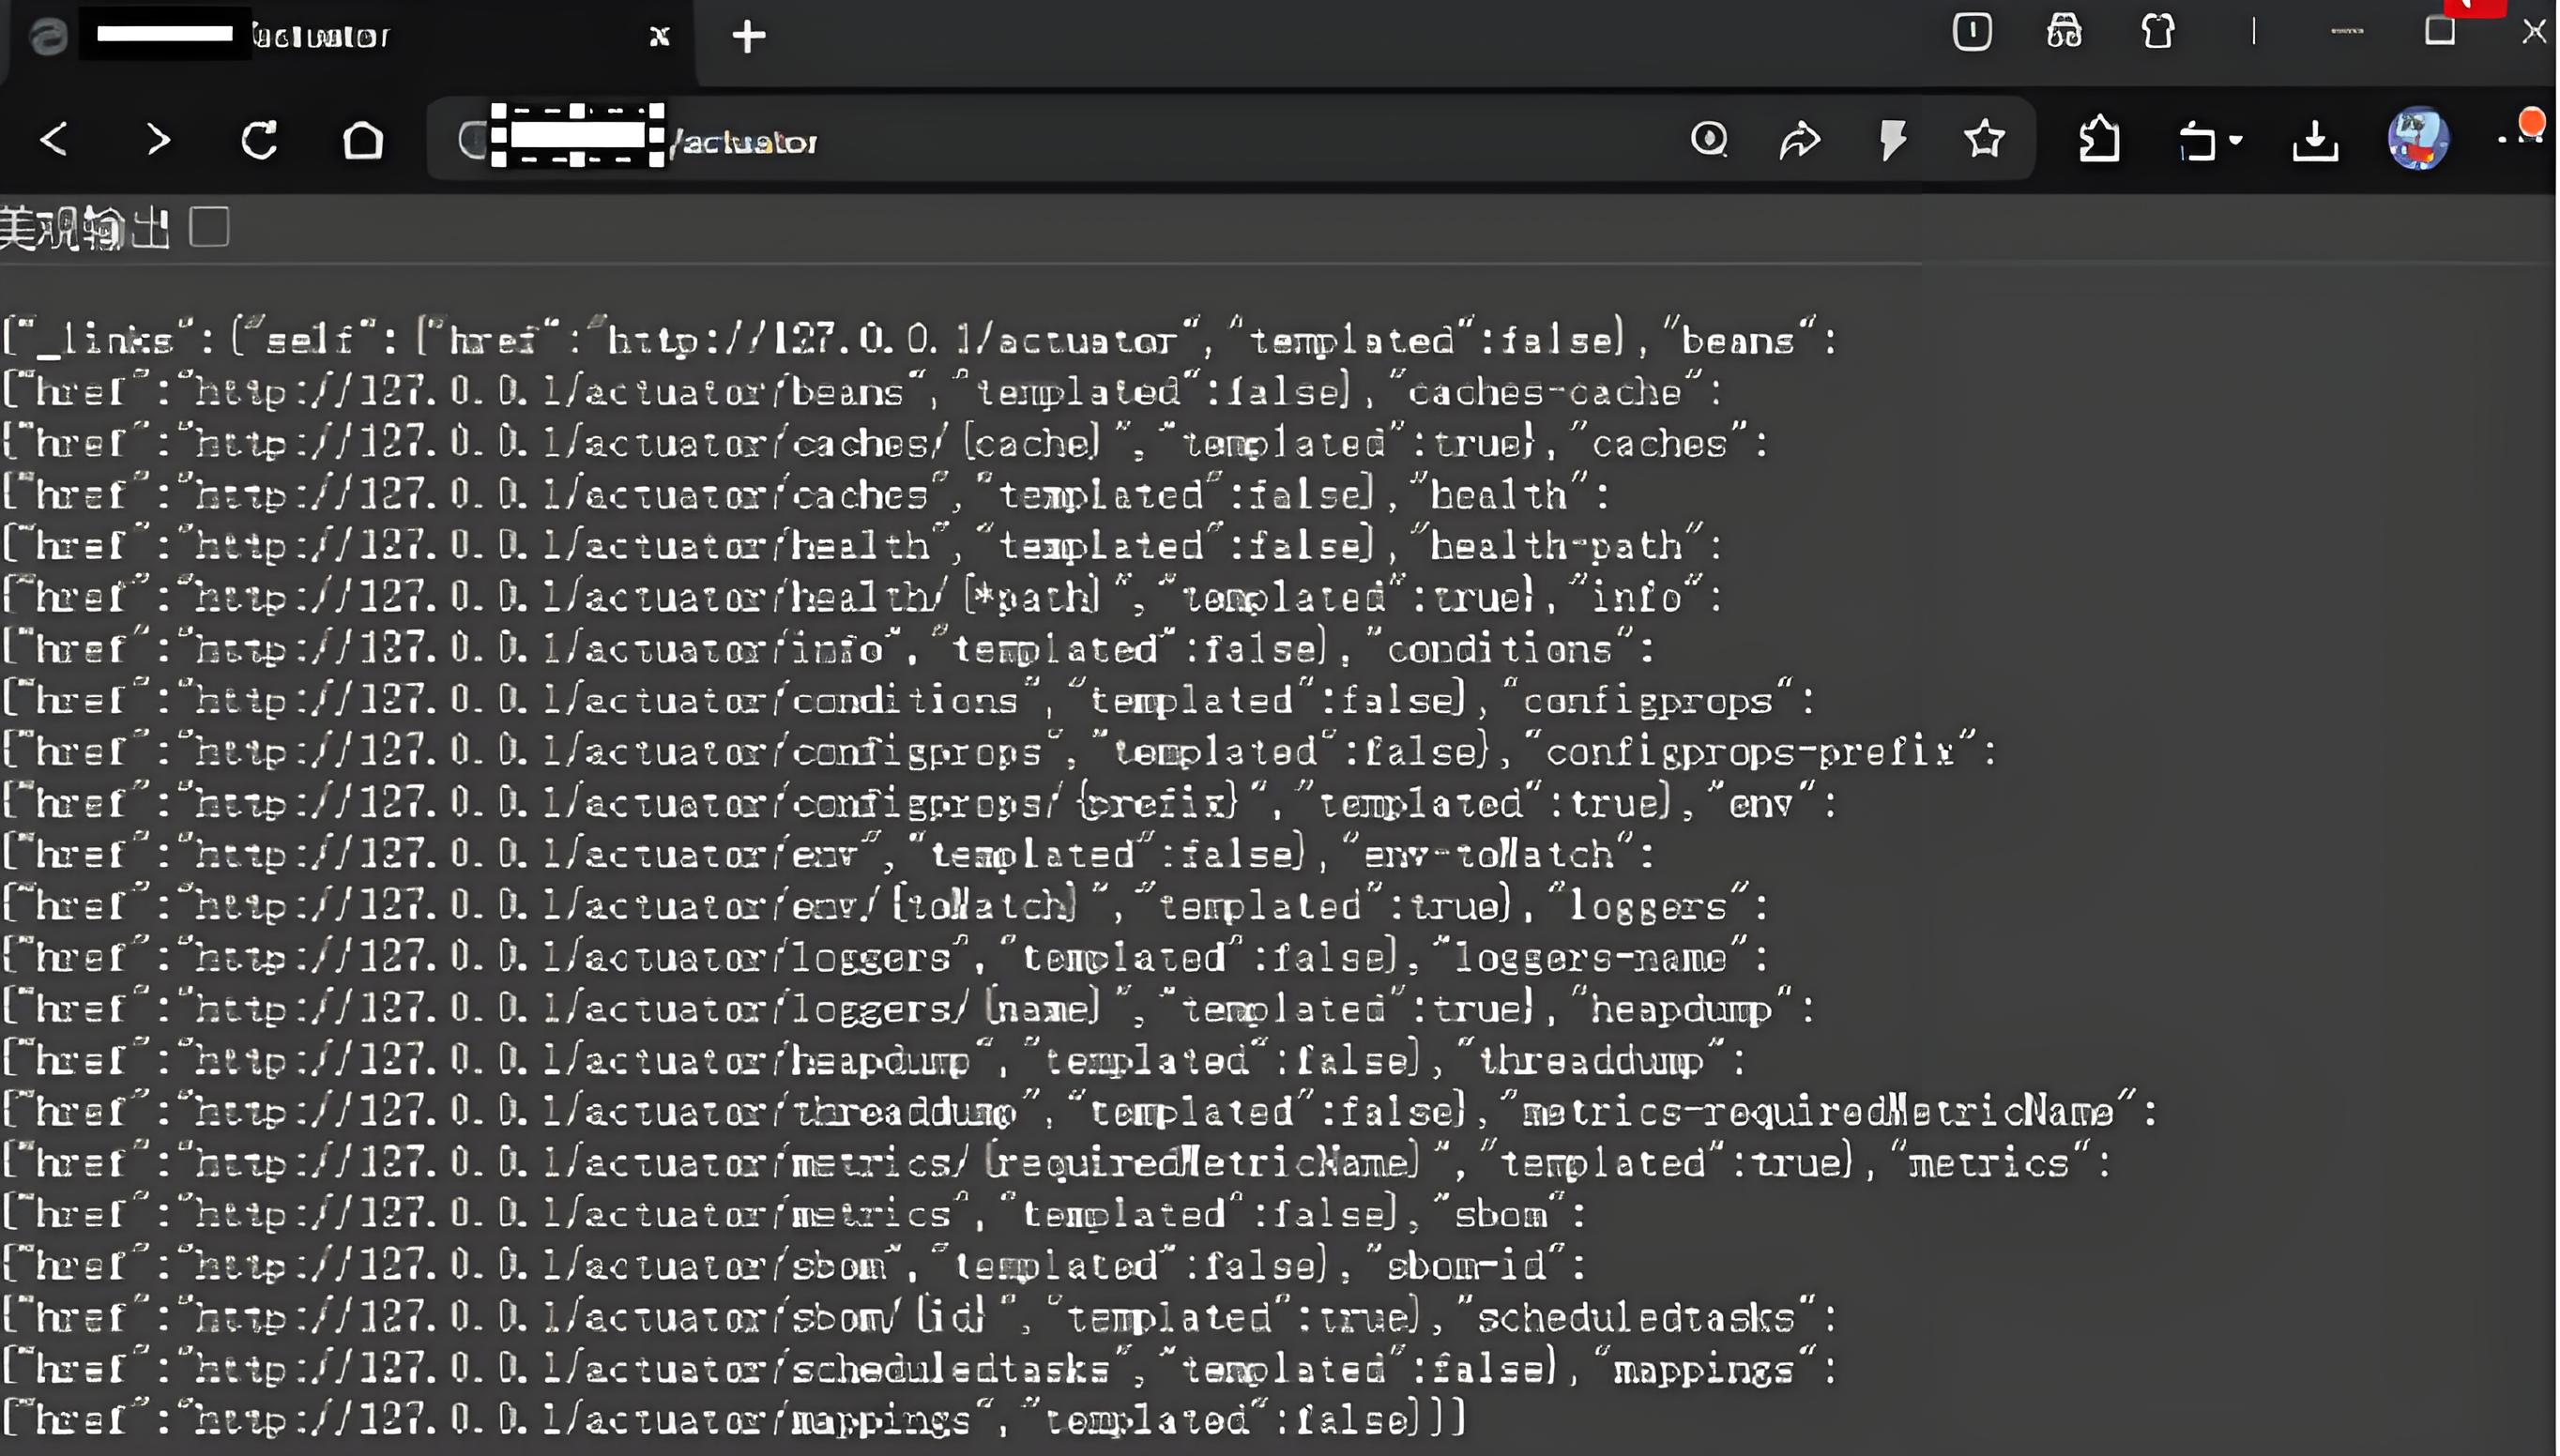
1.4、验证工程
启动项目
打开浏览器搜索
出下下面就对味了
二、格式化数据
2.1、添加maven依赖
将springboot产生的标准的端点数据,转换成普罗米修斯允许的格式
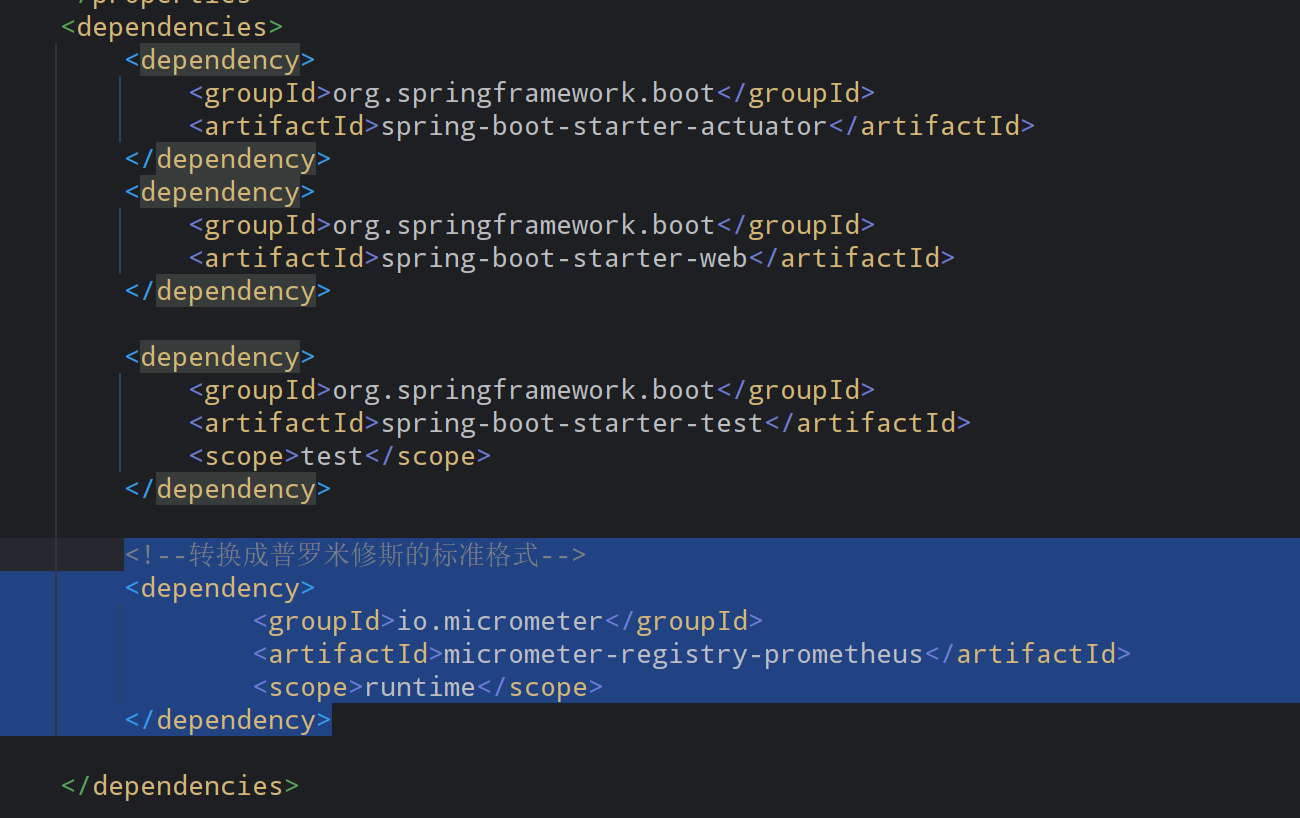
        <!--转换成普罗米修斯的标准格式-->
        <dependency>
                <groupId>io.micrometer</groupId>
                <artifactId>micrometer-registry-prometheus</artifactId>
                <scope>runtime</scope>
        </dependency>
2.2、编辑配置文件
endpoint:
  prometheus:
    enabled: true     //激活普罗米修斯,  让我们看到普罗米修斯转换后的格式
  health:       //查看更多健康信息
    show-details: always
metrics:
    export:
      enabled: true   //这些指标允许被导出
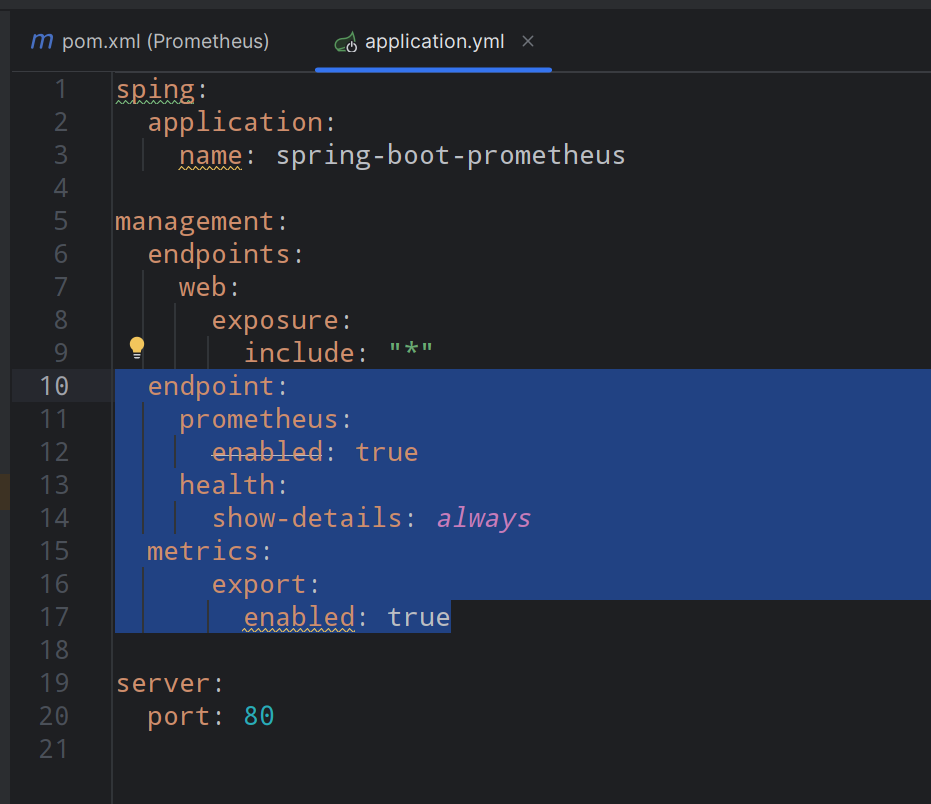
sping:
  application:
    name: spring-boot-prometheus

management:
  endpoints:
    web:
      exposure:
        include: "*"
  endpoint:
    prometheus:
      enabled: true
    health:
      show-details: always
  metrics:
      export:
        enabled: true

server:
  port: 80
2.3、重启项目、刷新浏览器
发现新增prometheus
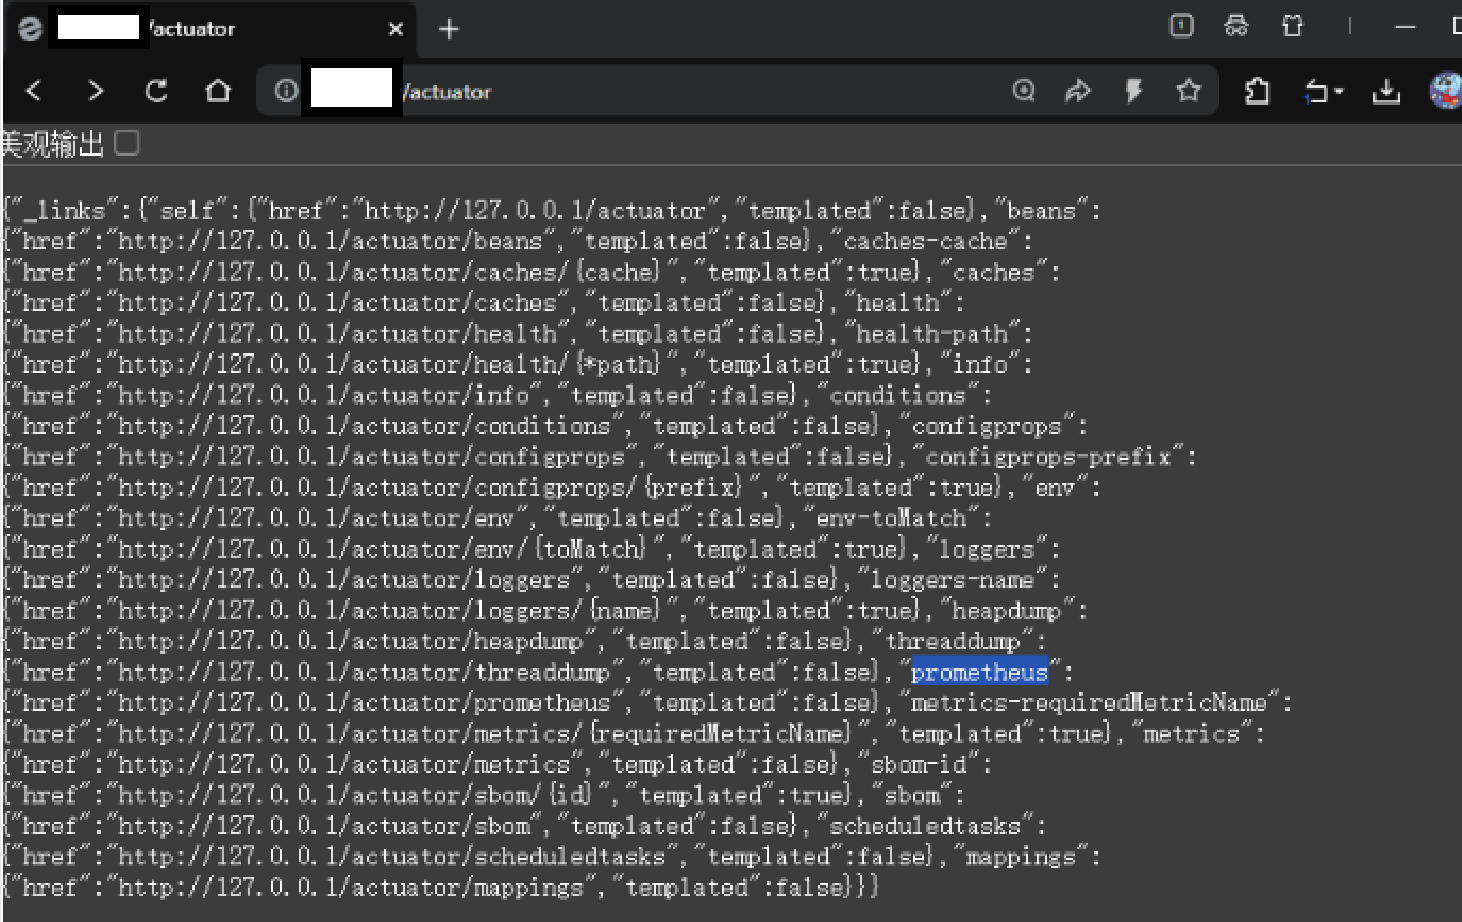
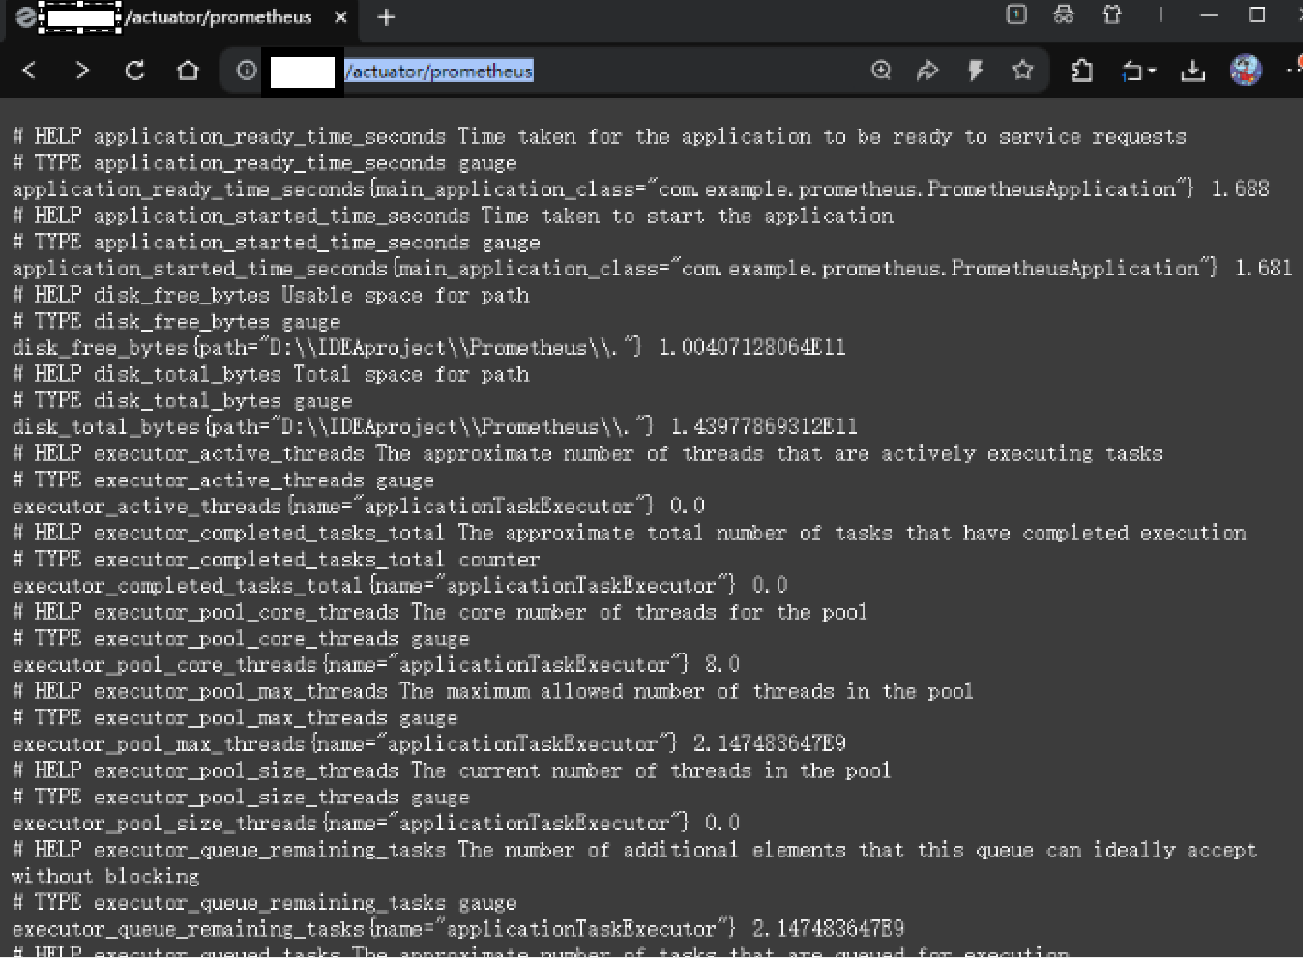
搜索
出现很多普罗米修斯的监控信息
三、 完善应用
打开启动类,新增方法
在我们向普罗米修斯注册的时候,额外附加应用的名字
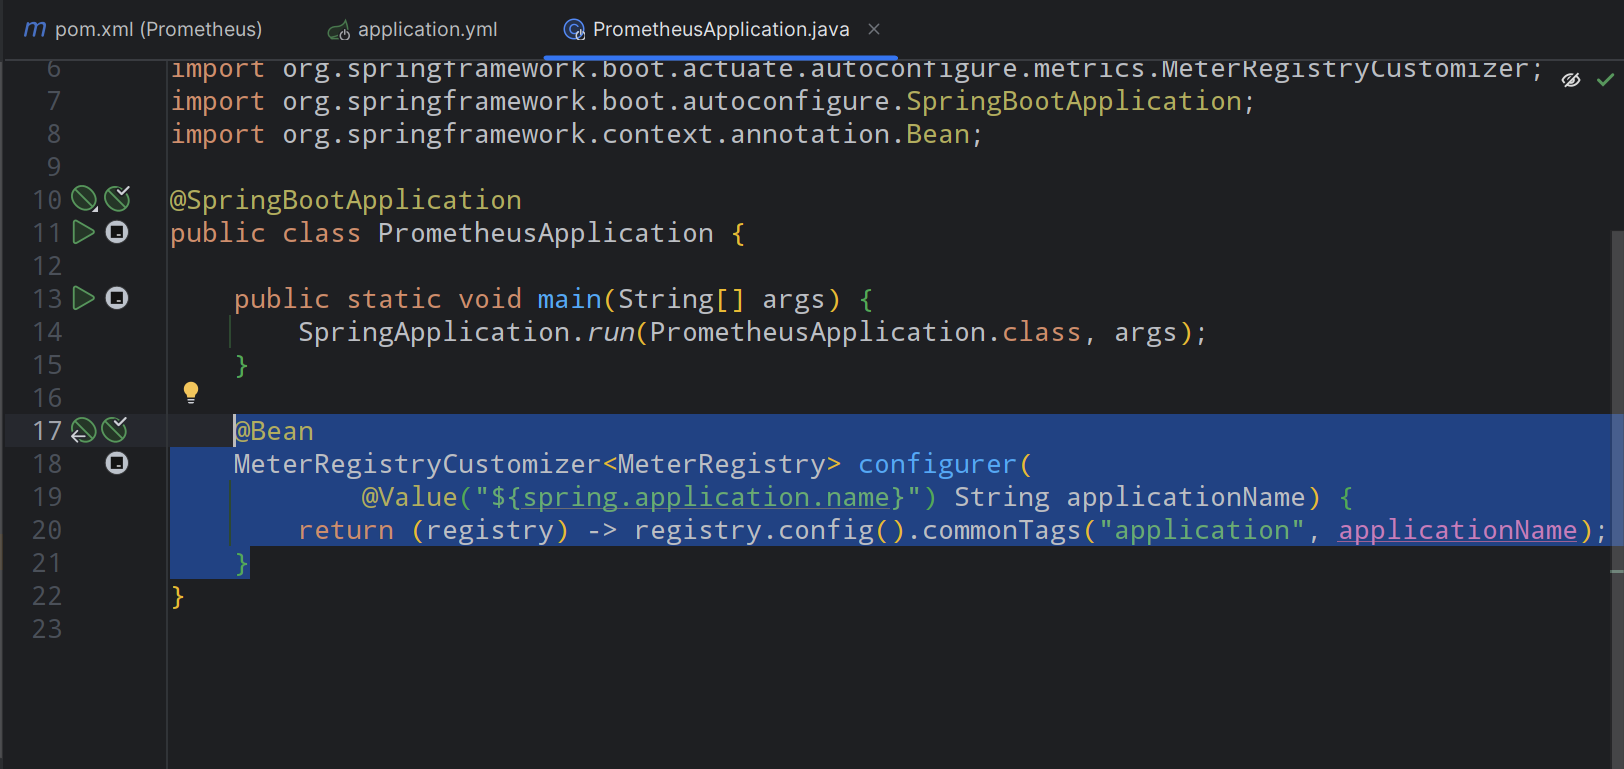
@SpringBootApplication
public class PrometheusApplication {

    public static void main(String[] args) {
        SpringApplication.run(PrometheusApplication.class, args);
    }

    @Bean
    MeterRegistryCustomizer<MeterRegistry> configurer(
            @Value("${spring.application.name}") String applicationName) {
        return (registry) -> registry.config().commonTags("application", applicationName);
    }
}
四、部署Prometheus
这里使用docker部署
4.1、编辑普罗米修斯的配置文件
创建以下目录:/etc/prometheus/prometheus.yml ,自己检查一下格式,粘贴可能会出错
# my global config
global:
  scrape_interval: 15s  # Set the scrape interval to every 15 seconds. Default is every 1 minute.
  evaluation_interval: 15s  # Evaluate rules every 15 seconds. The default is every 1 minute.
  # scrape_timeout is set to the global default (10s).

# Alertmanager configuration
alerting:
  alertmanagers:
    - static_configs:
        - targets:
            # - alertmanager:9093

# Load rules once and periodically evaluate them according to the global 'evaluation_interval'.
rule_files:
  # - "first_rules.yml"
  # - "second_rules.yml"

# A scrape configuration containing exactly one endpoint to scrape:
# Here it's Prometheus itself.
scrape_configs:
  # The job name is added as a label `job=<job_name>` to any timeseries scraped from this config.
  - job_name: "prometheus"
    # metrics_path defaults to '/metrics'
    # scheme defaults to 'http'.
    static_configs:
      - targets: ["localhost:9090"]

  # 以下内容为SpringBoot应用配置
  - job_name: "springboot_prometheus"  # 修正缩进,使用双引号
    scrape_interval: 5s
    metrics_path: "/actuator/prometheus"
    static_configs:
      - targets: ["ip:80"]  # 注意这里应该是你的SpringBoot应用实际地址
# 以下内容为SpringBoot应用配置
  - job_name: "springboot_prometheus"  # 新建一个任务
    scrape_interval: 5s    #间隔时间
    metrics_path: "/actuator/prometheus"
    static_configs:
      - targets: ["ip:80"]  # 注意这里应该是你的SpringBoot应用实际地址
4.2、运行容器
docker run -d --name=prometheus -v /etc/prometheus/prometheus.yml:/etc/prometheus/prometheus.yml --ip=192.168.88.119 --network macvlan31 bitnami/prometheus:latest
其中: --ip=192.168.88.119 --network macvlan31 是可选的
创建网络macvlan31
docker network create -d macvlan --subnet=192.168.88.0/24 --gateway=192.168.88.2 -o parent=ens33 macvlan31其中:
从ip addr输出可知: 物理网卡:ens33(IP 为 192.168.88.102/24)
子网:192.168.88.0/24(掩码为 255.255.255.0)
网关:需要通过ip route | grep default命令确认(如果输出是default via 192.168.88.1 dev ens33 proto dhcp metric 100 ,则网关是 192.168.88.1)
好用的镜像源
"registry-mirrors": [
"https://proxy.1panel.live",
"https://docker.1panel.top",
"https://docker.m.daocloud.io",
"https://docker.1ms.run",
"https://docker.ketches.cn"
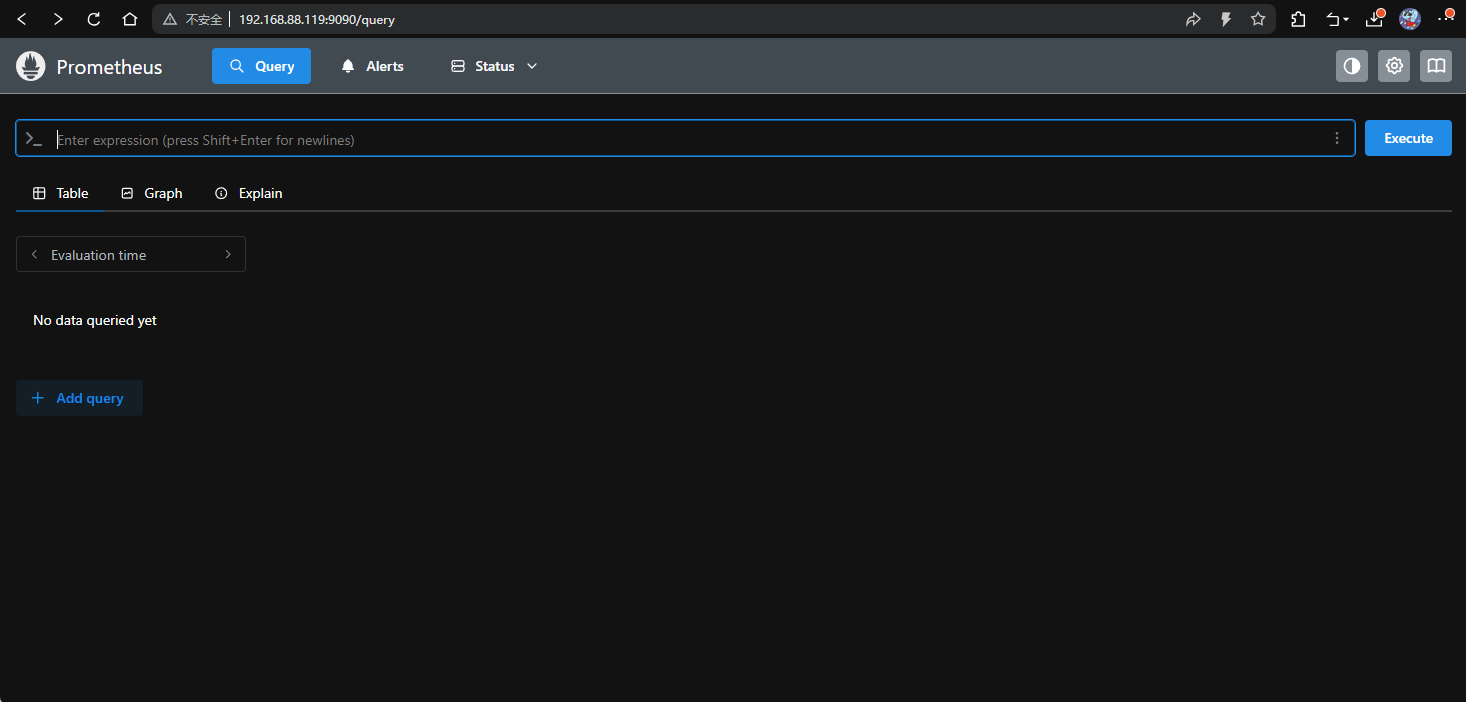
]4.3,、访问浏览器
http://192.168.88.119:9090/http://192.168.88.119:9090 http://192.168.88.119:9090/
其中ip是docker run 中配置的,如果没有配置,自己查看默认ip访问即可
出现如下
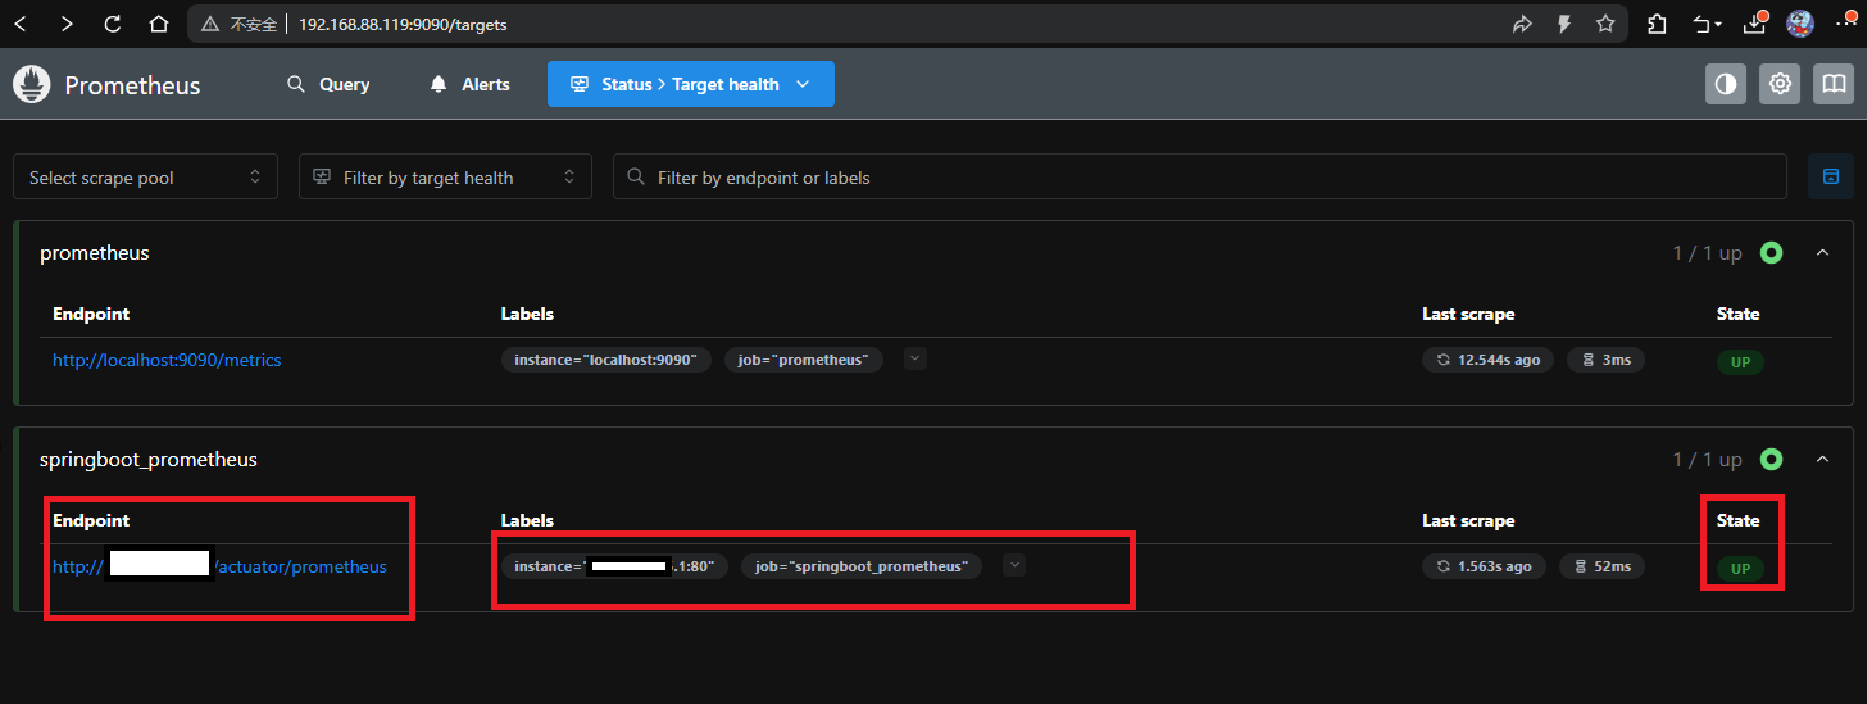
点击Status中的Target
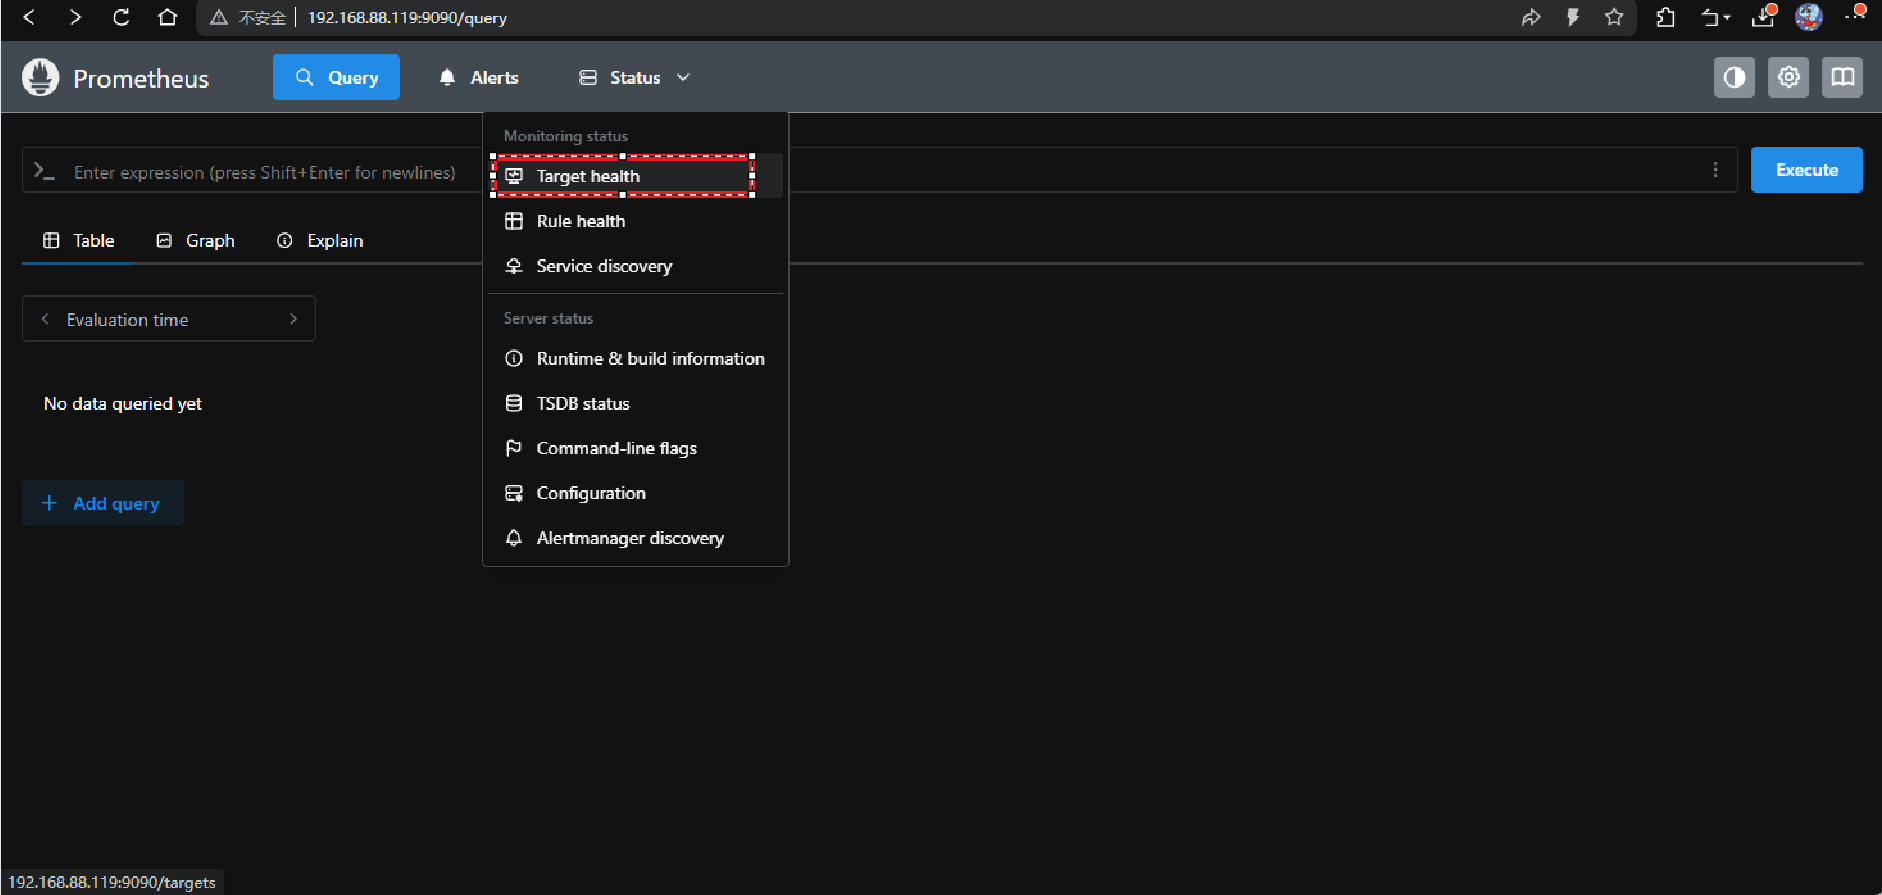
出现下面三点就好了
五、部署Grafana
4.1、创建容器
docker run -d --name=grafana --ip=192.168.88.118 --network macvlan31 grafana/grafana
4.2、访问浏览器
登录admin、密码admin。。
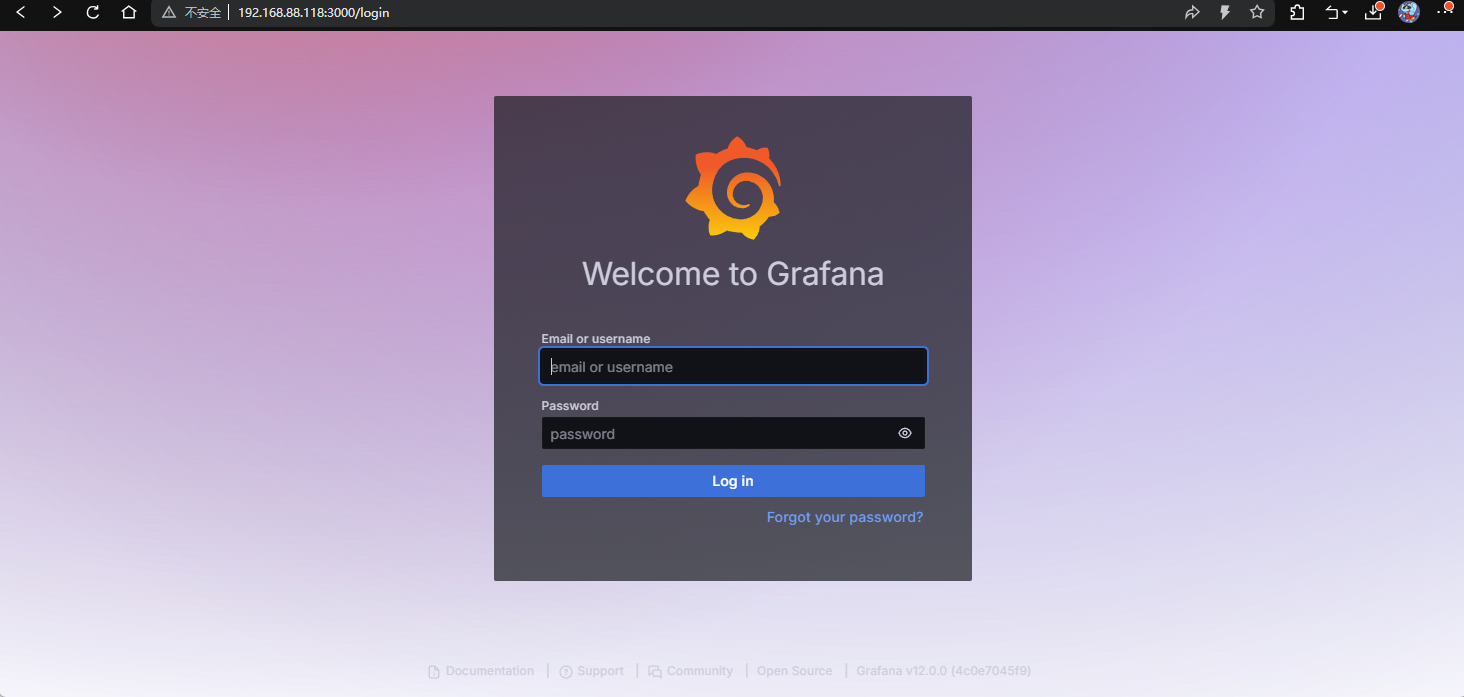 登录后需要改密码
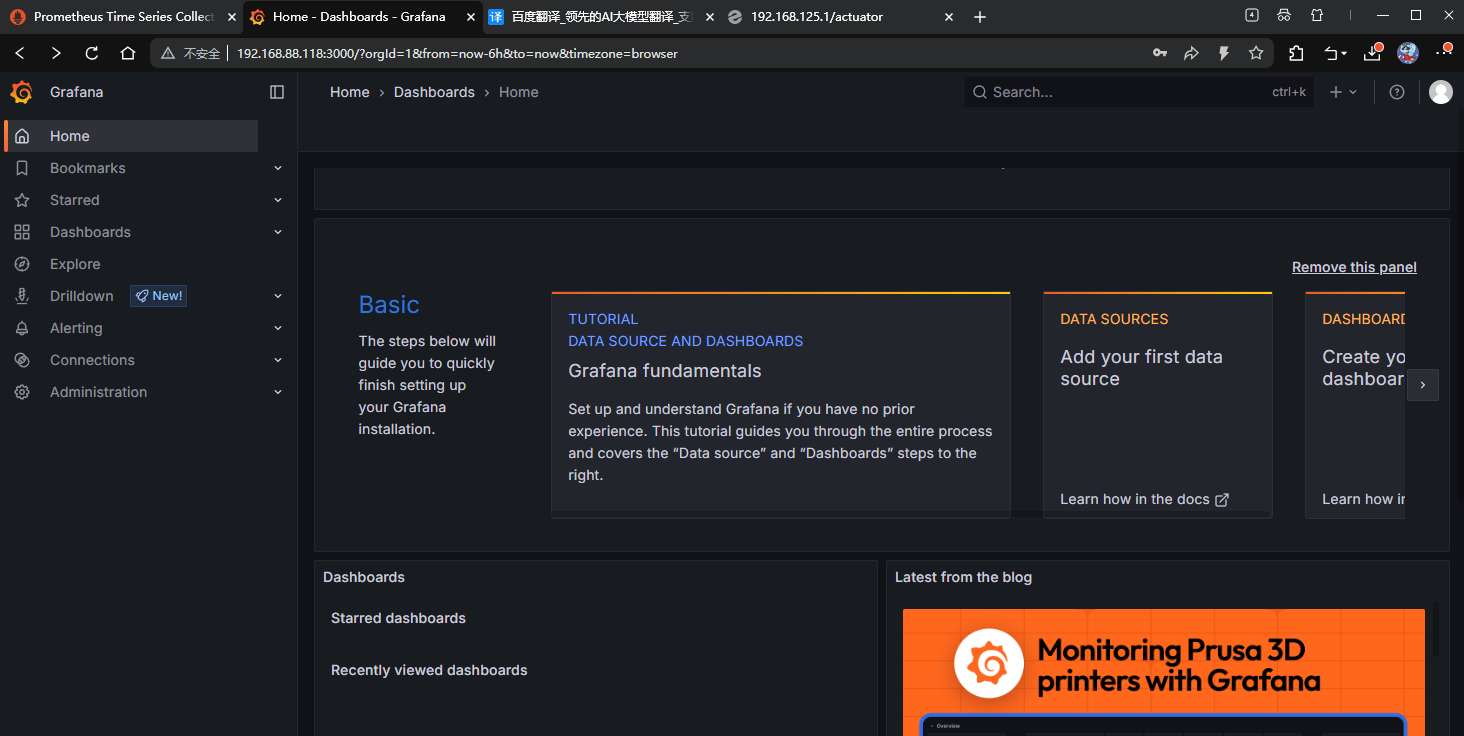
4.3、 Prometheus与Grafana关联
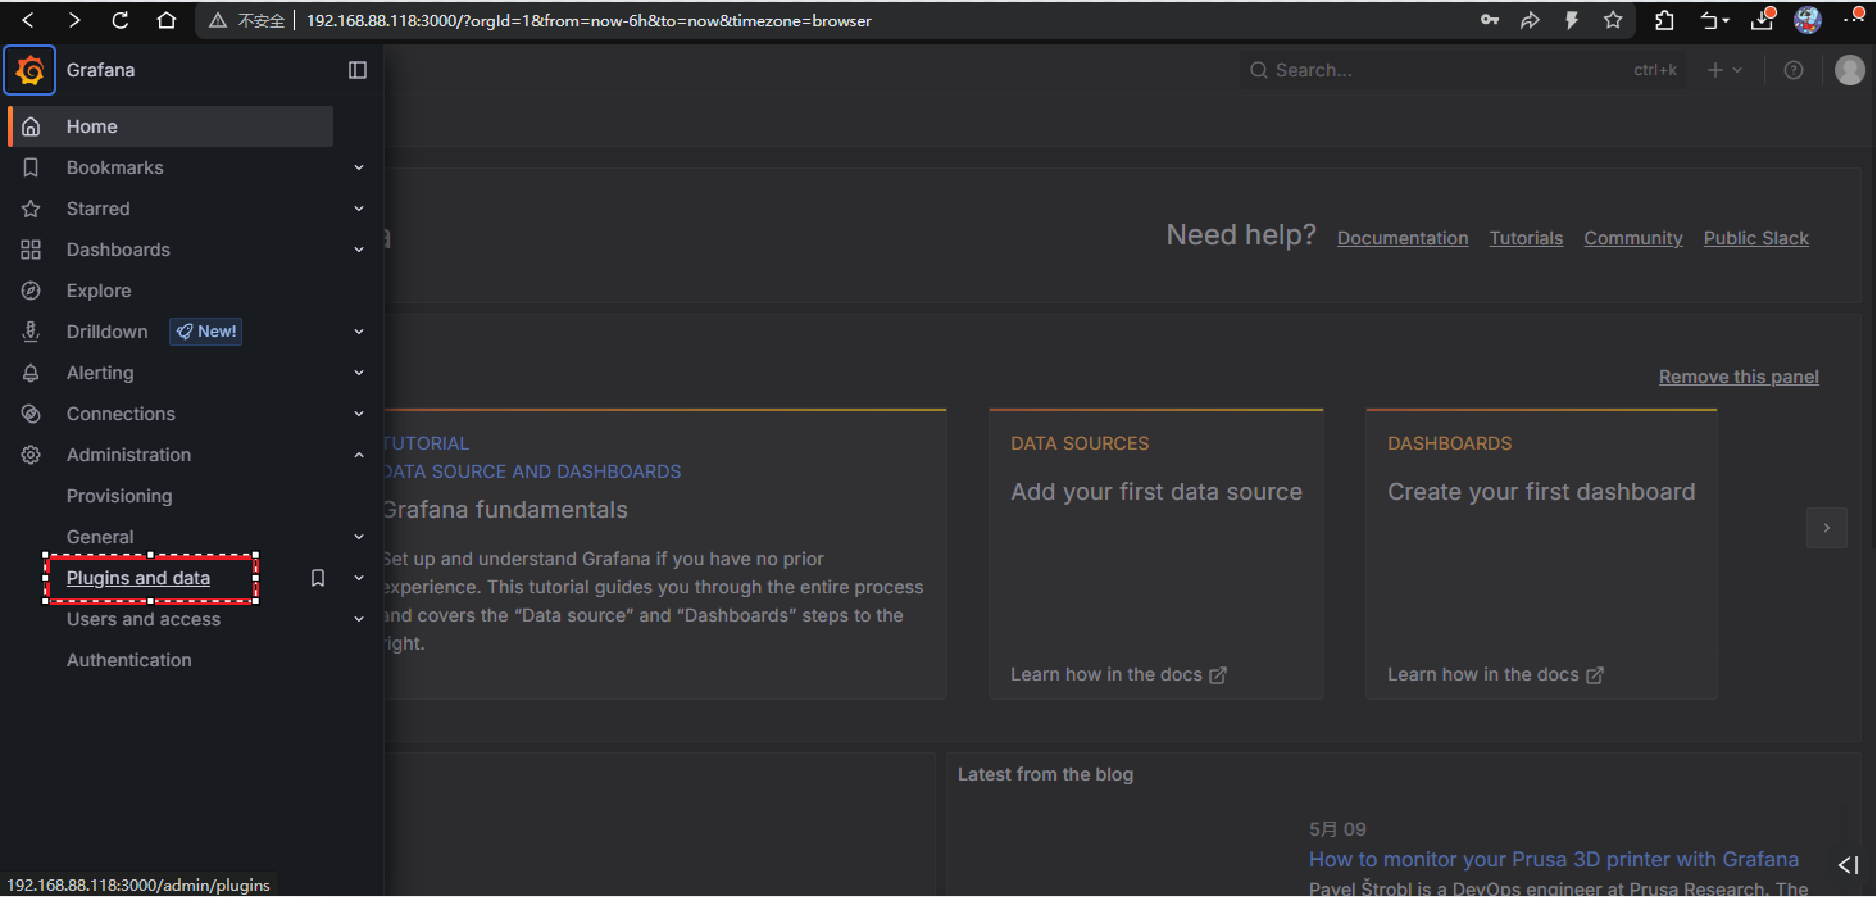
点击Plugins,出现下面
搜索Prometheus,并选择
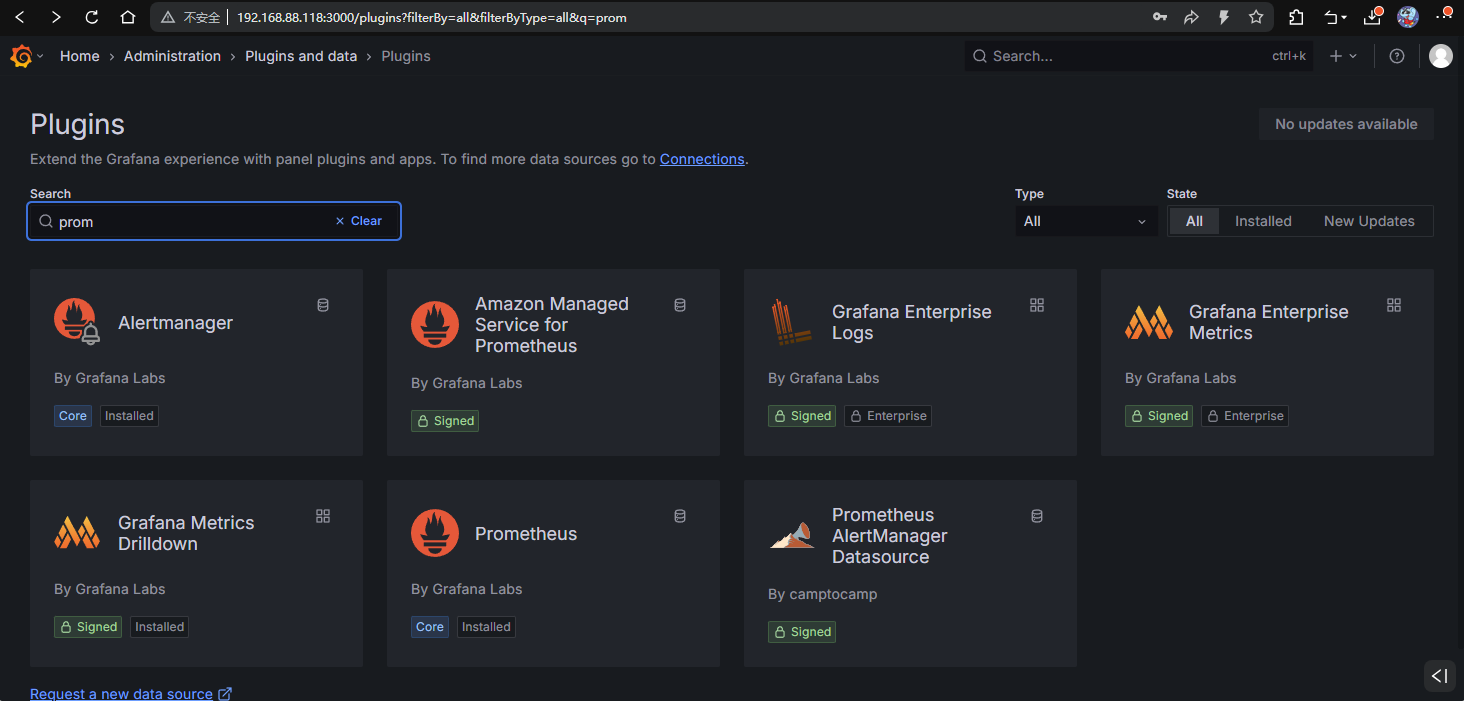
右上角添加
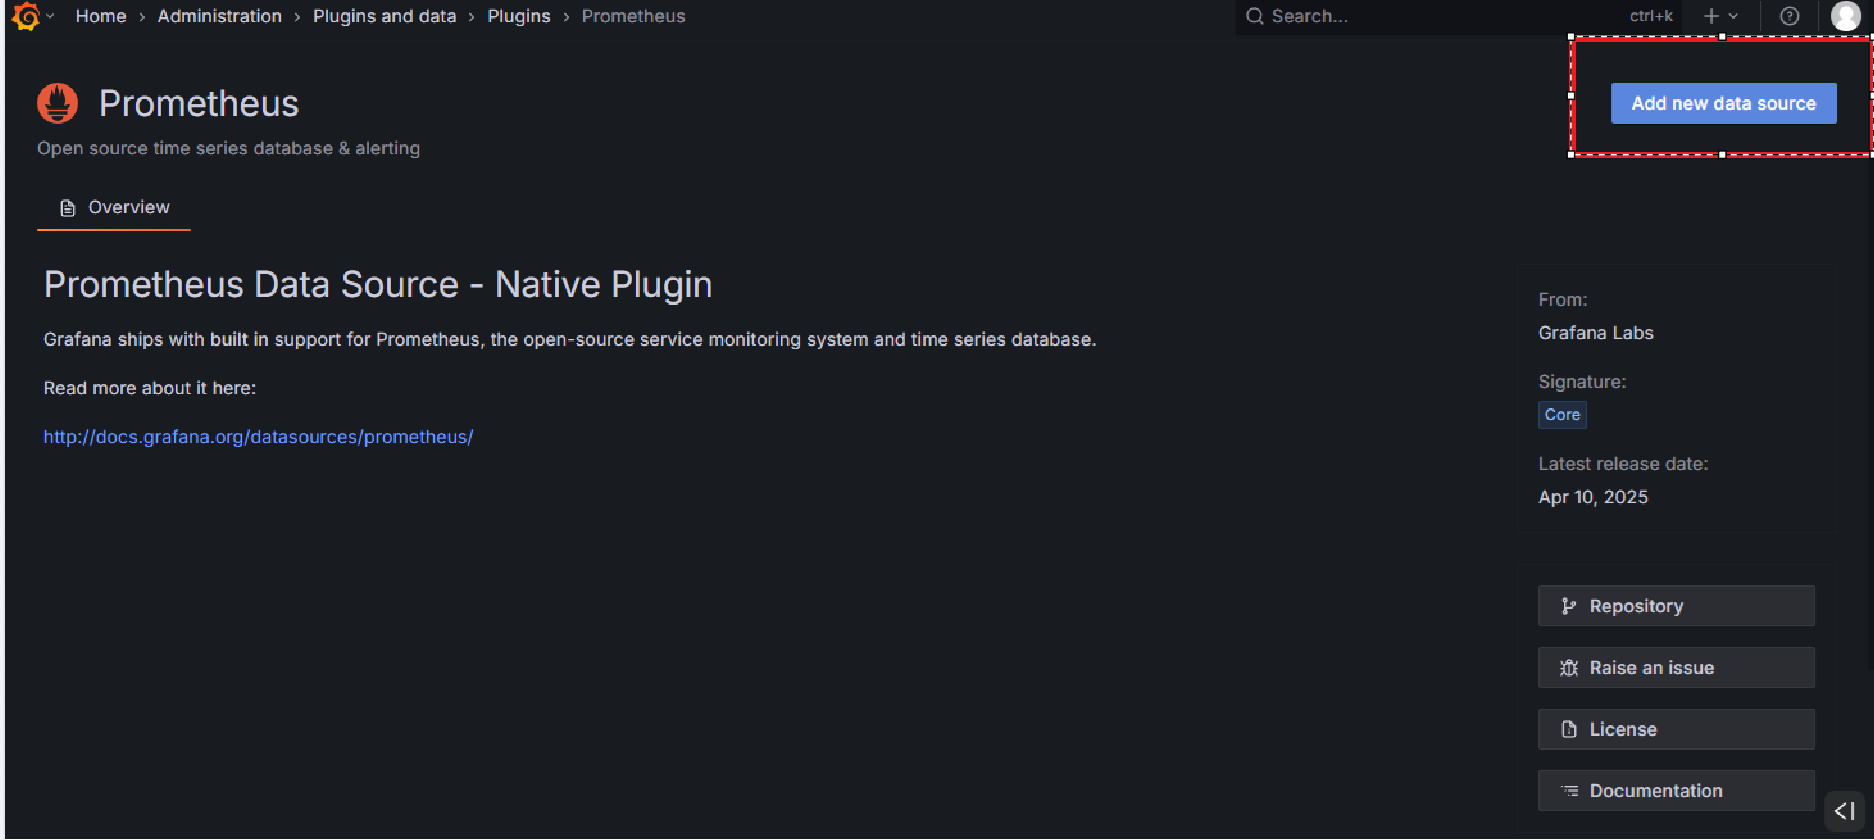
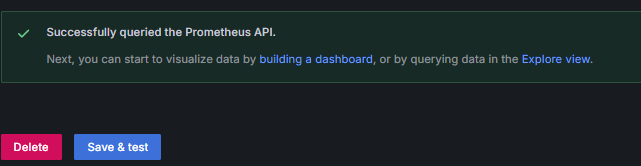
添加普罗米修斯的url,点击下方保存
 出现对钩,进行下一步
搜索
![]()
输入4701,load
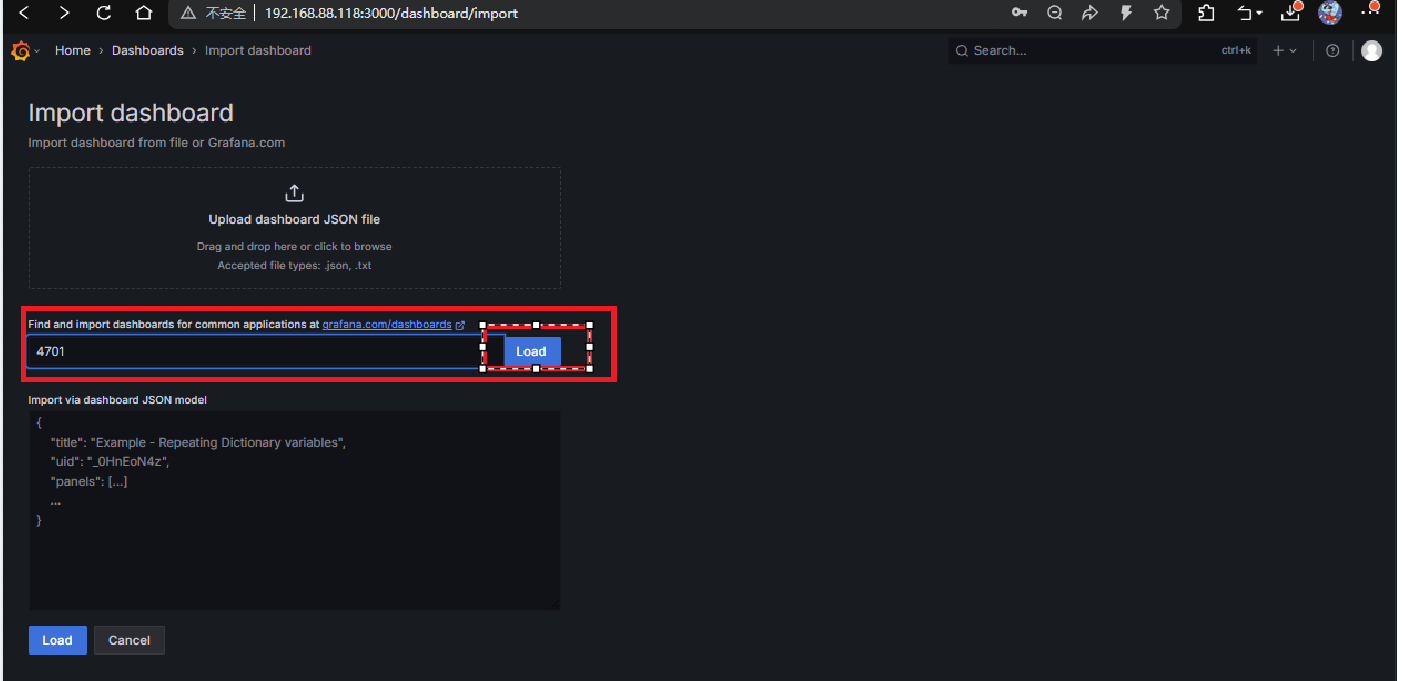
4701是官方对应springboot应用的模板,点击下面的 Grafana.com,就能访问模板仓库,里面有大量的好看 的表盘
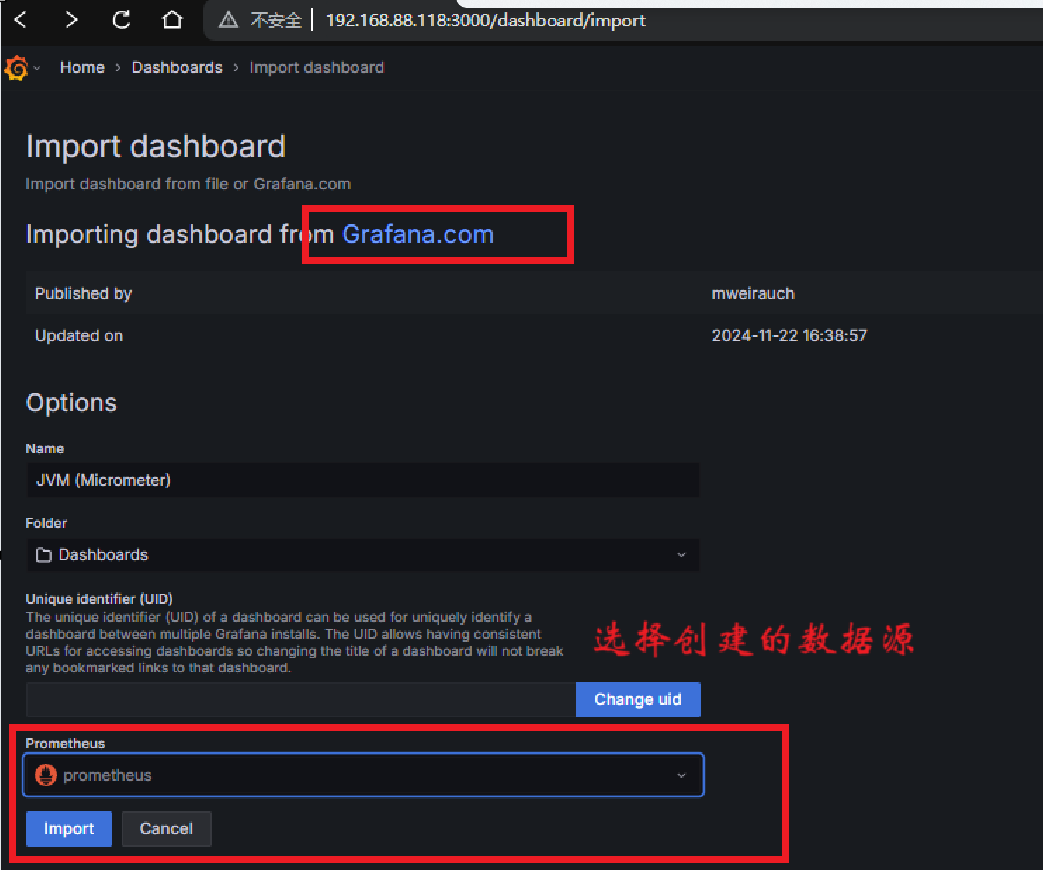 就可以完成表盘监控了
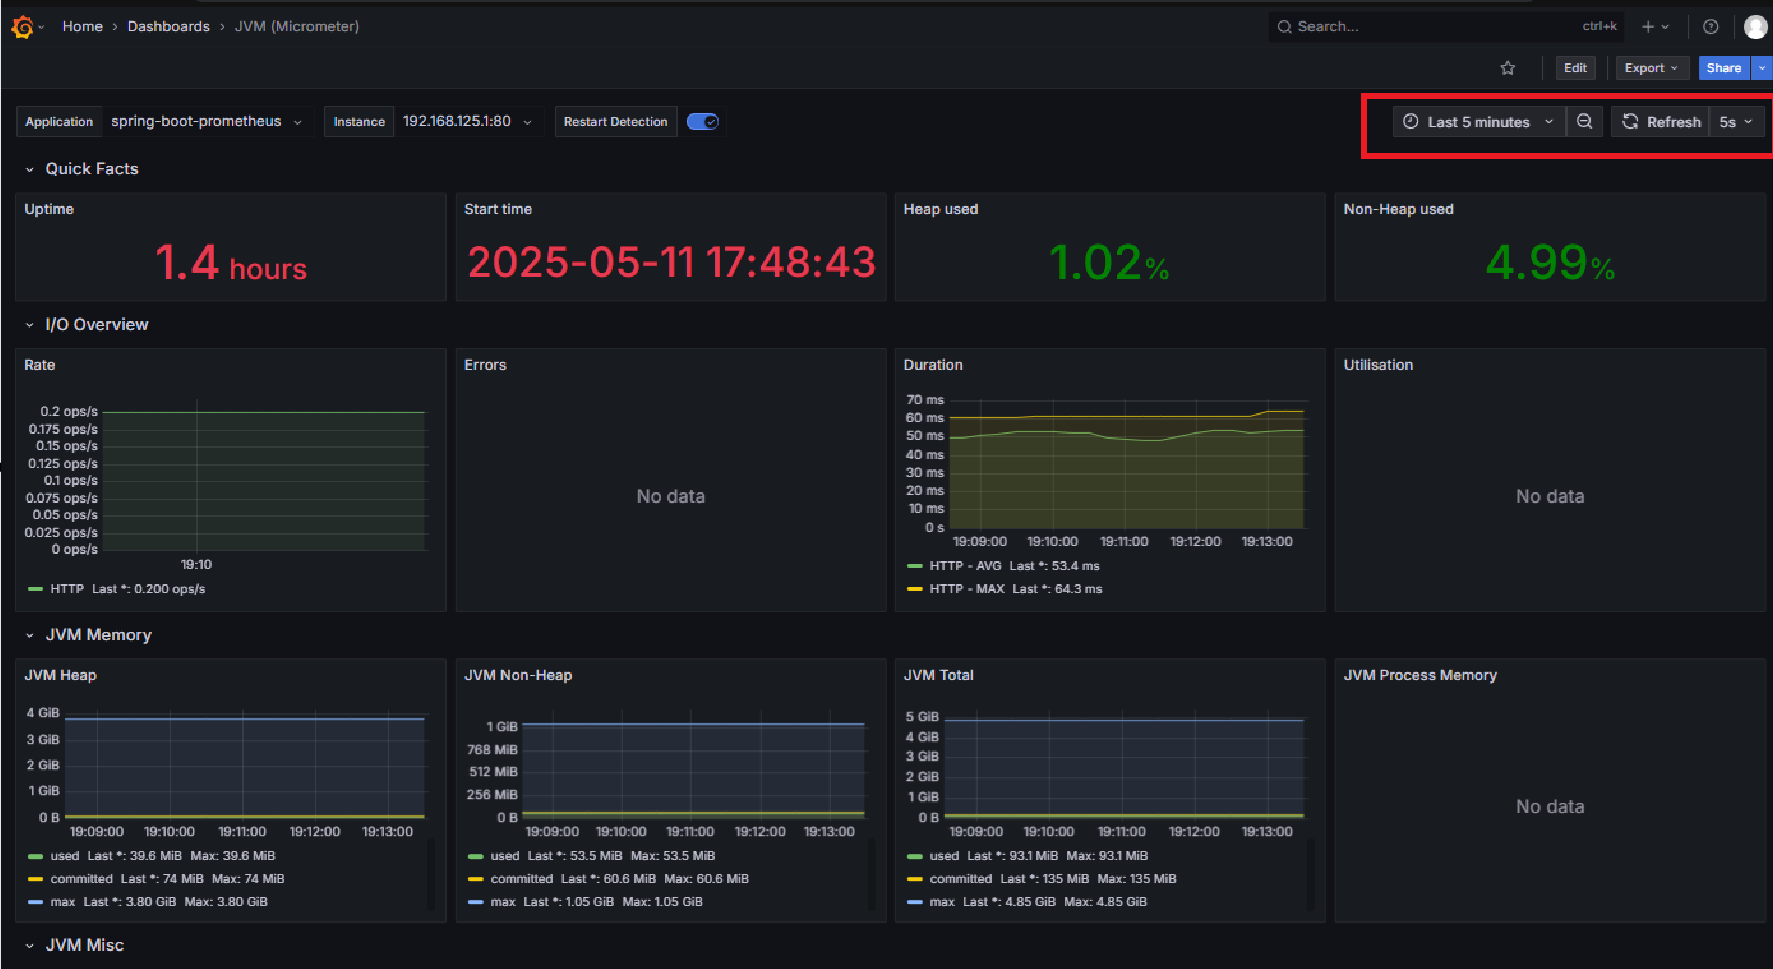
在这里可以监控JVM、 io、cpu、堆等重要信息
原文地址: https://www.bilibili.com/video/BV1LA4y1D7JE?vd_source=1e0ca825b1ef2b1c1c5f38c2dd7fcb88


 3776
3776

 被折叠的 条评论
为什么被折叠?
被折叠的 条评论
为什么被折叠?
 到【灌水乐园】发言


