


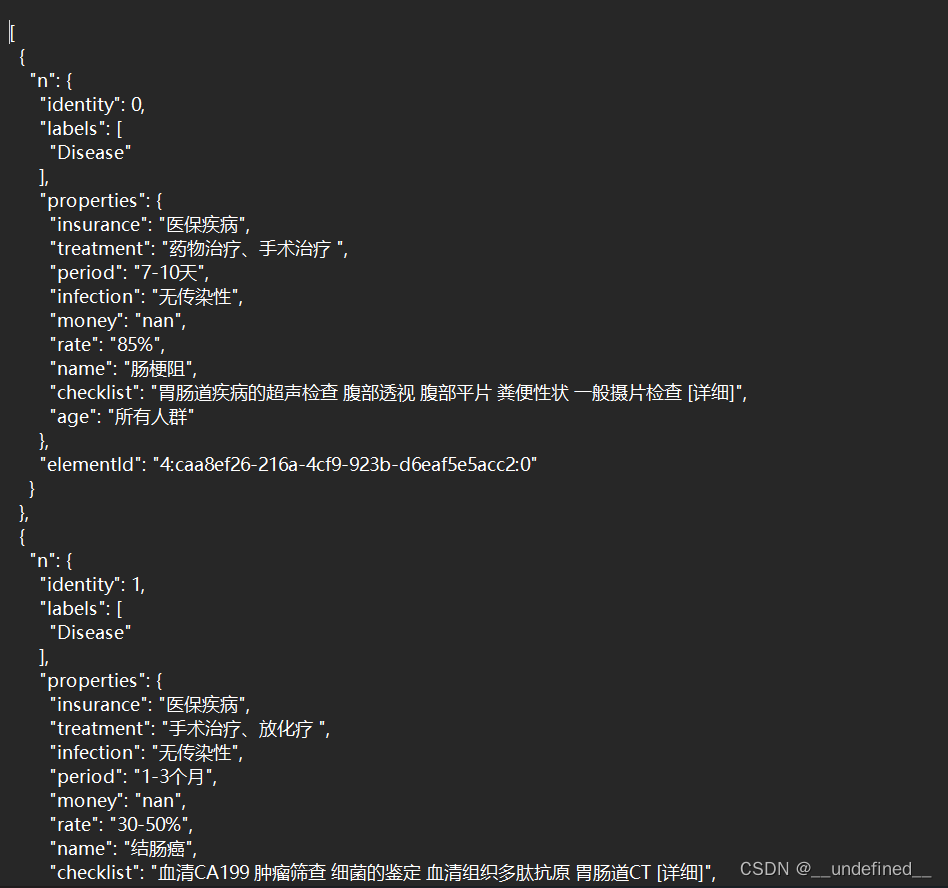
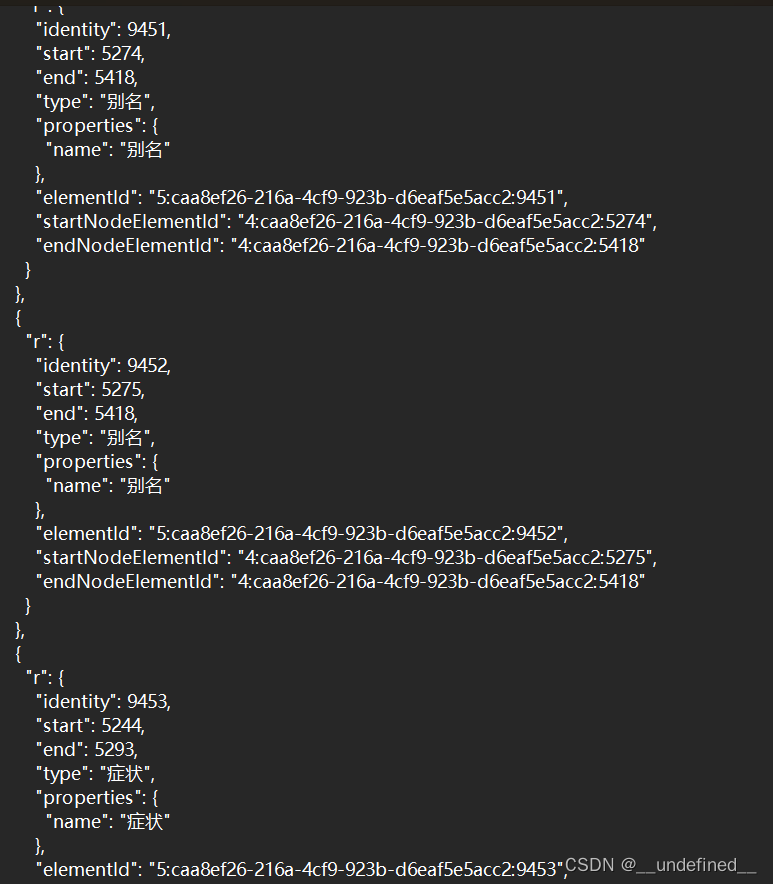
由于neo4j数据库本身不支持直接嵌入到vue页面中,于是我将数据库中创建好的节点与关系导出,保存为json文件,在vue中利用echarts可视化。
可视化:
加载数据、以及绘制初始知识图谱:
async loadData() {
            try {
                await Promise.all([
                    this.loadNodes(),
                    this.loadRelations(),
                ]);
                this.initChart();
            } catch (error) {
                console.error('Failed to load data:', error);
                alert('数据加载失败,请重试!');
            }
        },

        loadNodes() {
            return axios.get("node1.json")
                .then(response => {
                    this.parseNodes(response.data);
                })
                .catch(error => {
                    console.error('Failed to load nodes:', error);
                    throw error;
                });
        },

        loadRelations() {
            return axios.get("relation1.json")
                .then(response => {
                    this.parseRelations(response.data);
                })
                .catch(error => {
                    console.error('Failed to load relations:', error);
                    throw error;
                });
        },

        parseNodes(data) {
            const nodeIdMap = new Map();
            this.nodes = data.map(item => ({
                id: String(item.n.identity),
                label: item.n.labels[0], // 取第一个标签作为节点类型
                name: item.n.properties.name,
                property: item.n.properties,
            })).filter(node => {
                // 只保留指定的节点类型
                const validLabels = ['Disease', 'Symptom', 'Complication', 'Drug'];
                return validLabels.includes(node.label);
            });
        },


        parseRelations(data) {
            this.links = data.map(item => ({
                source: String(item.r.start),
                target: String(item.r.end),
                type: item.r.type,
            }));
        },

        initChart() {
            this.chart = echarts.init(this.$refs.main);
            this.drawGraph();

            // 监听节点点击事件
            this.chart.on('click', params => {
                if (params.dataType === 'node') {
                    this.showRelatedNodes(params.data);
                }
            });
        },

        drawGraph() {
            const options = {
                tooltip: {
                    trigger: 'item',
                    formatter: function (params) {
                        let htmlContent = '节点信息:<br/>';
                        if (params.data.property) {
                            for (let key in params.data.property) {
                                if (params.data.property.hasOwnProperty(key)) {
                                    htmlContent += `${key}: ${params.data.property[key]}<br/>`;
                                }
                            }
                        } else {
                            htmlContent += '没有额外的属性信息。';
                        }
                        return htmlContent;
                    },
                },
                series: [
                    {
                        type: 'graph',
                        layout: 'force',
                        legendHoverLink: true,
                        hoverAnimation: true,
                        roam: true,
                        draggable: true,
                        symbolSize: 60,
                        edgeSymbol: [],
                        edgeSymbolSize: [4, 10],
                        force: {
                            repulsion: 2000,
                            gravity: 0.5,
                            edgeLength: [120, 240],
                        },
                        emphasis: {
                            focus: 'adjacency',
                            label: {
                                show: true,
                            },
                        },
                        lineStyle: {
                            width: 1,
                        },
                        edgeLabel: {
                            show: true,
                            formatter: function (x) {
                                return x.data.type;
                            },
                        },
                        label: {
                            show: true,
                            formatter: '{b}',
                            fontSize: 10,
                        },
                        itemStyle: {
                            color: function (params) {
                                const colorMap = {
                                    'Disease': '#FFB6C1',
                                    'Symptom': '#C7CEEA',
                                    'Complication': '#FFCC99',
                                    'Drug': '#C4C4C4',
                                };
                                return colorMap[params.data.label] || '#808080';
                            },
                            symbolSize: function (params) {
                                // 根据节点类型设置不同的大小
                                if (params.data.label === 'Disease') {
                                    return 80; // 设定 disease 节点的大小为50
                                } else {
                                    return 40; // 其他节点大小为默认值40
                                }
                            },
                        },
                        data: this.nodes,
                        links: this.links,
                    },
                ],
            };
            this.chart.setOption(options);
        },
        resetGraph(){
            this.drawGraph();
            this.query = ''
            return;
        },
交互功能:用户可以点击节点查看与其相关的节点,并且可以进行搜索:
searchNode() {
            if (!this.query) {
                this.drawGraph();
                return;
            }
            const matchedNodes = this.nodes.filter(node => node.name.includes(this.query));
            if (matchedNodes.length > 0) {
                const targetNode = matchedNodes[0]; // 假设只关注第一个匹配的节点
                this.showRelatedNodes(targetNode);
            } else {
                alert('没有找到匹配的节点');
            }
        },
        showRelatedNodes(targetNode) {
            // 用于存储需要显示的节点和连接
            const visibleNodes = [];
            const visibleLinks = [];

            // 辅助函数,递归查找与节点相关的节点和连接
            const findRelatedNodes = (nodeId) => {
                // 查找当前节点的所有连接
                const connectedLinks = this.links.filter(link =>
                    link.source === nodeId || link.target === nodeId
                );

                connectedLinks.forEach(link => {
                    visibleLinks.push(link);

                    // 包括连接的节点在visibleNodes中
                    if (link.source !== nodeId) {
                        const connectedNode = this.nodes.find(n => n.id === link.source);
                        if (connectedNode && !visibleNodes.some(n => n.id === connectedNode.id)) {
                            visibleNodes.push(connectedNode);
                            findRelatedNodes(connectedNode.id); // 递归查找下一层节点
                        }
                    }
                    if (link.target !== nodeId) {
                        const connectedNode = this.nodes.find(n => n.id === link.target);
                        if (connectedNode && !visibleNodes.some(n => n.id === connectedNode.id)) {
                            visibleNodes.push(connectedNode);
                            findRelatedNodes(connectedNode.id); // 递归查找下一层节点
                        }
                    }
                });
            };

            // 添加目标节点及其直接连接的节点
            visibleNodes.push(Object.assign({}, targetNode, { itemStyle: { color: 'red' } }));
            findRelatedNodes(targetNode.id);

            if (visibleNodes.length === 0) {
                alert('没有找到匹配的节点');
                this.drawGraph(); // 重置为初始状态
                return;
            }

            // 创建新的选项对象
            const newOptions = {
                series: [{
                    type: 'graph',
                    layout: 'force',
                    data: visibleNodes,
                    links: visibleLinks,
                    force: {
                        repulsion: 2000,
                        gravity: 0.5,
                        edgeLength: [120, 240],
                    },
                    lineStyle: {
                        width: 1,
                    },
                    label: {
                        show: true,
                        formatter: '{b}',
                        fontSize: 10,
                    },
                    itemStyle: {
                        color: function (params) {
                            const colorMap = {
                                'Disease': '#FFB6C1',
                                'Symptom': '#C7CEEA',
                                'Complication': '#FFCC99',
                                'Drug': '#C4C4C4',
                            };
                            return colorMap[params.data.label] || '#808080';
                        },
                    },
                }],
            };

            // 将更新后的选项应用到图表
            if (this.chart) {
                this.chart.setOption(newOptions);

                // 查找目标节点的索引
                const dataIndex = visibleNodes.findIndex(node => node.id === targetNode.id);

                if (dataIndex !== -1) {
                    this.chart.dispatchAction({
                        type: 'focusNodeAdjacency',
                        seriesIndex: 0,
                        dataIndex: dataIndex
                    });
                } else {
                    console.warn('Target node not found in updated data.');
                }
            } else {
                console.error('ECharts instance is not initialized.');
            }
        }
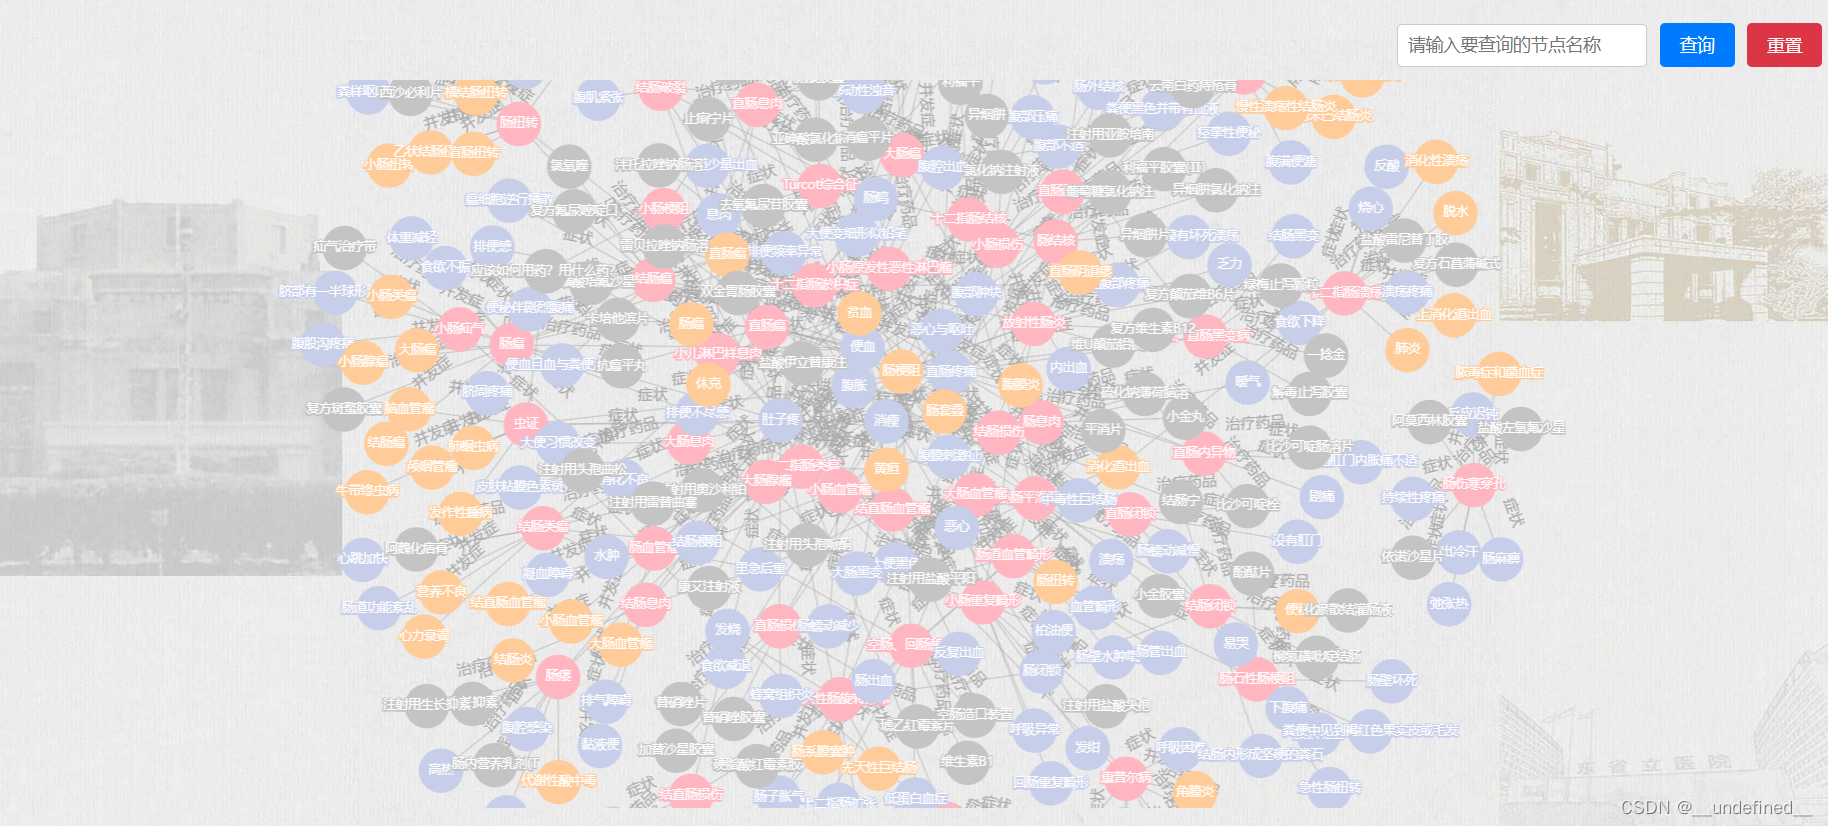
最终效果:
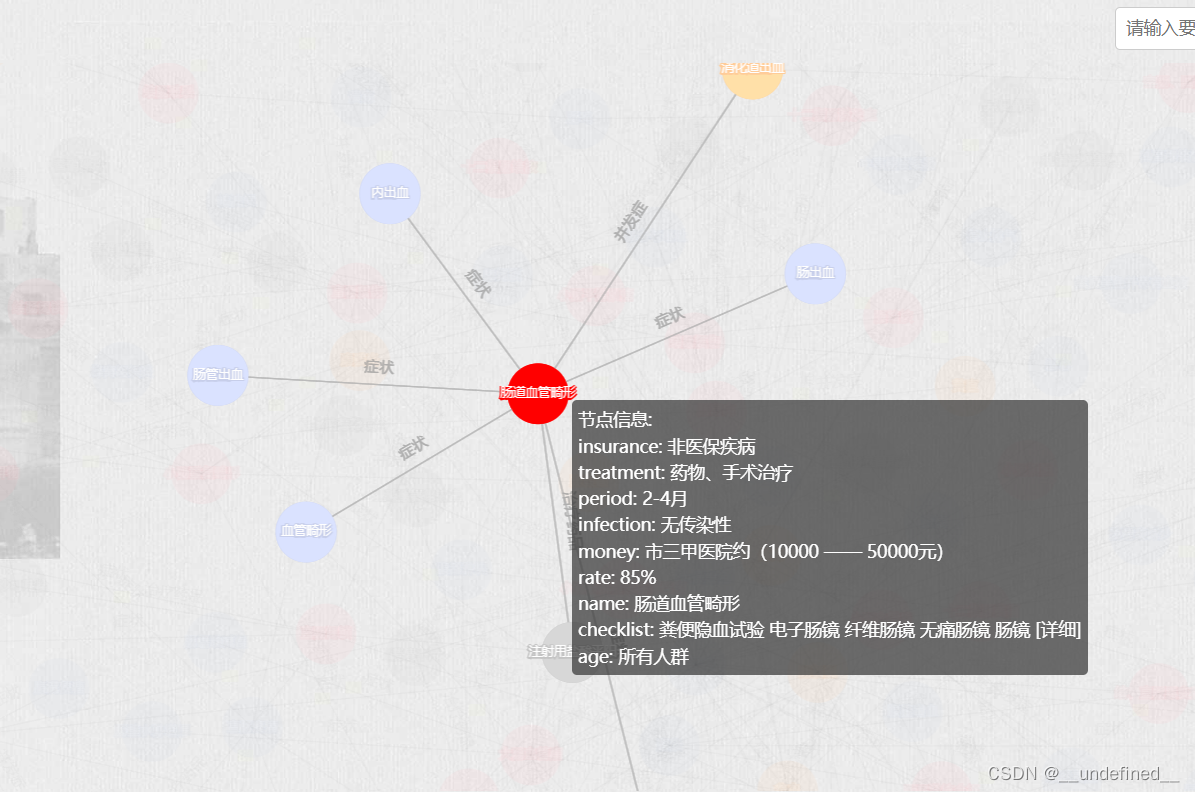
用户可以缩放图片、点击节点、搜索节点等。
点击节点后,使其突出显示:


 4093
4093

 被折叠的 条评论
为什么被折叠?
被折叠的 条评论
为什么被折叠?
 到【灌水乐园】发言


